8  Graphics

📖 Status of the book

Hi there! This book is a work-in-progress. You may like to come back later when it’s closer to a complete state. If you would like to raise issues or leave feedback, please feel to do this:

The grammar of graphics is an object oriented programming framework to computational express multitude of graphics based on a relatively small number of rules. The framework requires the data to be organised in a manner such that data variables are mapped a particular plot element. The grammar of graphics is extensively explained in the seminal book, Wilkinson (2005), and various interpretations are implemented in different systems (e.g. R, Python, Julia, Tableau) with the most popular one being the R-package ggplot2 by Wickham (2016).

I illustrate below some basics of ggplot2 but those who wish to know more about the framework is advised to read Wickham (2016). If you want to learn more about using the system to draw plots, then you are advised to read Chang (2018).

In the first instance, we load the tidyverse package and data about weight gain of 50 pigs for five different feed treatments. The data, contained in the object crampton.pig, has rows corresponding to each pig and five columns:

library(tidyverse) # includes `ggplot2`
data(crampton.pig, package = "agridat")
glimpse(crampton.pig)
Rows: 50
Columns: 5
$ treatment <fct> T1, T1, T1, T1, T1, T1, T1, T1, T1, T1, T2, T2, T2, T2, T2, …
$ rep       <fct> R1, R2, R3, R4, R5, R6, R7, R8, R9, R10, R1, R2, R3, R4, R5,…
$ weight1   <int> 30, 21, 21, 33, 27, 24, 20, 29, 28, 26, 26, 24, 20, 35, 25, …
$ feed      <int> 674, 628, 661, 694, 713, 585, 575, 638, 632, 637, 699, 626, …
$ weight2   <int> 195, 177, 180, 200, 197, 170, 150, 180, 192, 184, 194, 204, …
8.1 Mapping

Mapping, provided through aes, links the data to plot aesthetics. This can be specified through the ggplot() function as shown in the code below where the input data is crampton.pig and the mapping is such that weight1 and weight2 will be shown in the x-axis and y-axis, respectively, treatment depicted by color, and feed depicted by size. This is just specifying the data and mapping though so no graph is shown in the plot.

gbase <- ggplot(data = crampton.pig,
                mapping = aes(x     = weight1,
                              y     = weight2,
                              color = treatment,
                              size  = feed)) 

gbase

8.2 Layers

To draw graphs, layers must be specified by appending a LayerInstance object.

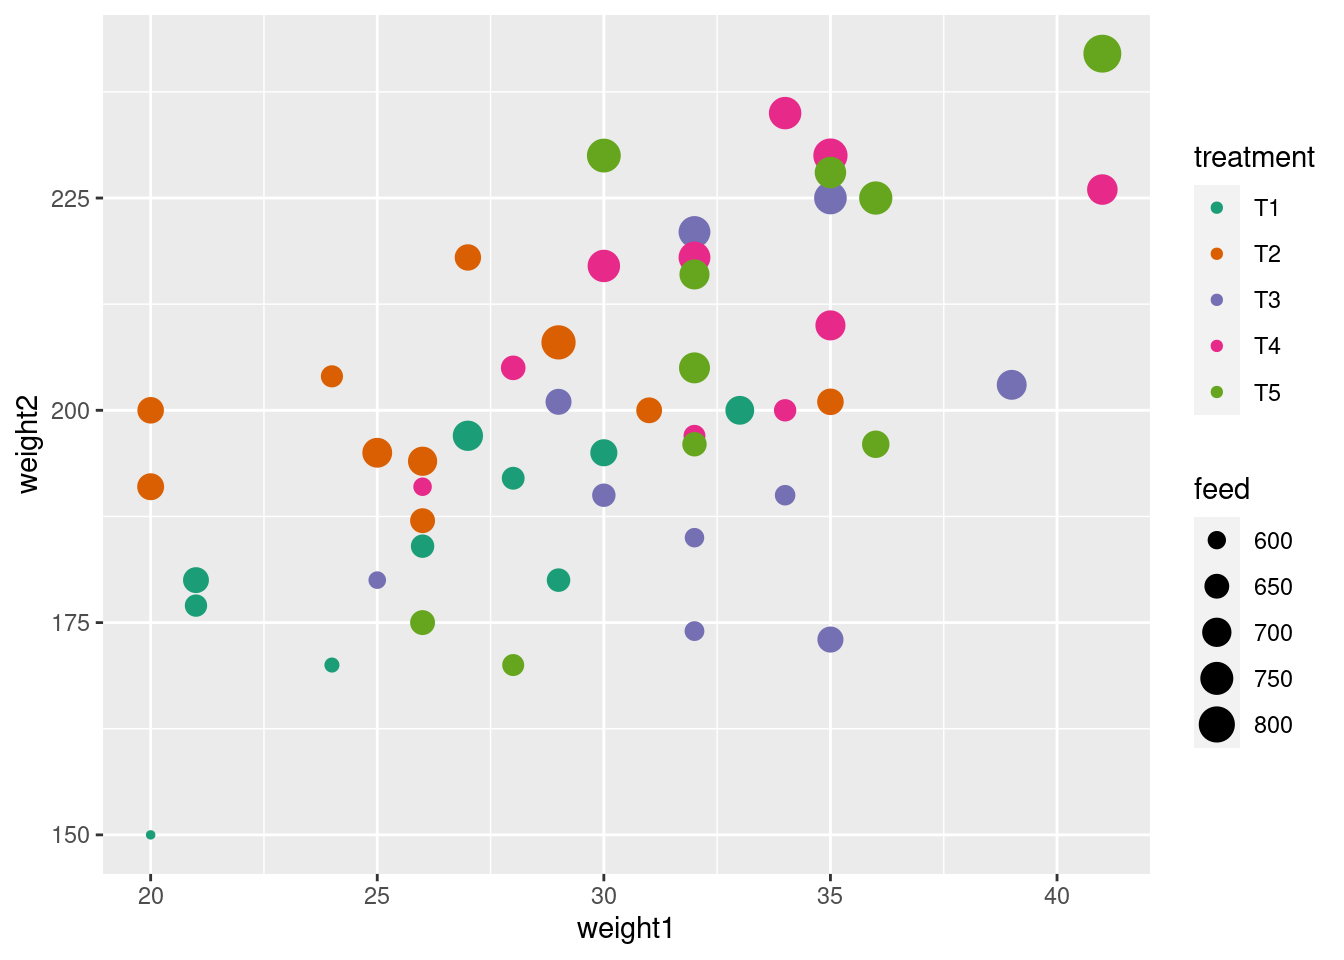
gscatter <- gbase + geom_point()

gscatter

gboxplot <- ggplot(data = crampton.pig,
                   mapping = aes(x = treatment,
                                 y = weight2 - weight1)) +
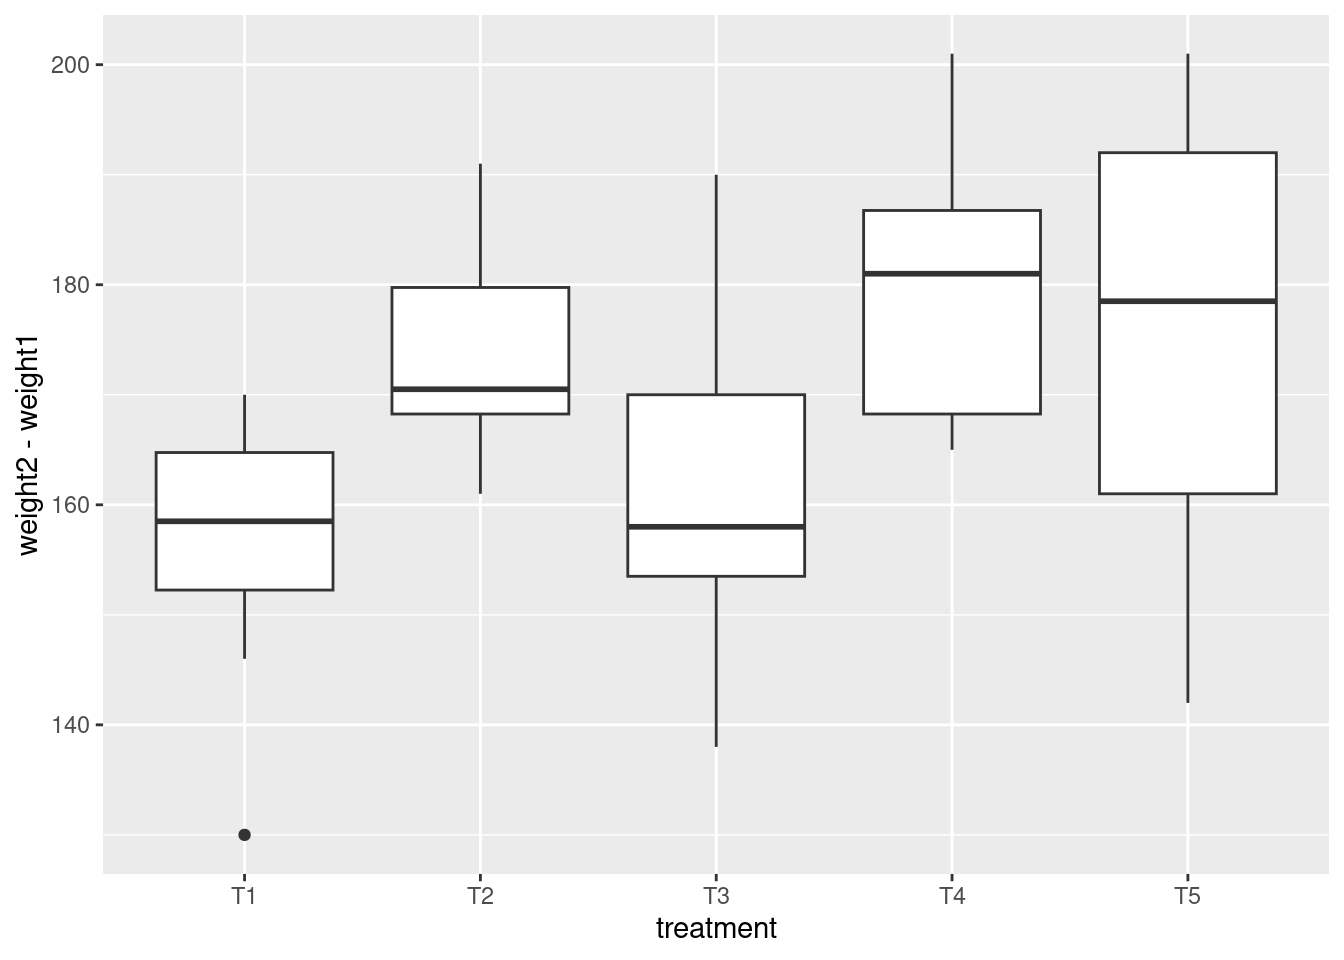
            geom_boxplot()
gboxplot

layer_data(gboxplot)
  ymin  lower middle  upper ymax outliers notchupper notchlower x flipped_aes
1  146 152.25  158.5 164.75  170      130   164.7455   152.2545 1       FALSE
2  161 168.25  170.5 179.75  191            176.2459   164.7541 2       FALSE
3  138 153.50  158.0 170.00  190            166.2441   149.7559 3       FALSE
4  165 168.25  181.0 186.75  201            190.2433   171.7567 4       FALSE
5  142 161.00  178.5 192.00  201            193.9888   163.0112 5       FALSE
  PANEL group ymin_final ymax_final  xmin  xmax xid newx new_width weight
1     1     1        130        170 0.625 1.375   1    1      0.75      1
2     1     2        161        191 1.625 2.375   2    2      0.75      1
3     1     3        138        190 2.625 3.375   3    3      0.75      1
4     1     4        165        201 3.625 4.375   4    4      0.75      1
5     1     5        142        201 4.625 5.375   5    5      0.75      1
  colour  fill alpha shape linetype linewidth
1 grey20 white    NA    19    solid       0.5
2 grey20 white    NA    19    solid       0.5
3 grey20 white    NA    19    solid       0.5
4 grey20 white    NA    19    solid       0.5
5 grey20 white    NA    19    solid       0.5
gboxplot$layers[[1]]$geom$draw_group
...
outliers_grob <- GeomPoint$draw_panel(outliers, ...)
...
ggname("geom_boxplot", 
       grobTree(outliers_grob, 
                GeomSegment$draw_panel(whiskers, ...), 
                GeomCrossbar$draw_panel(box, ...)))
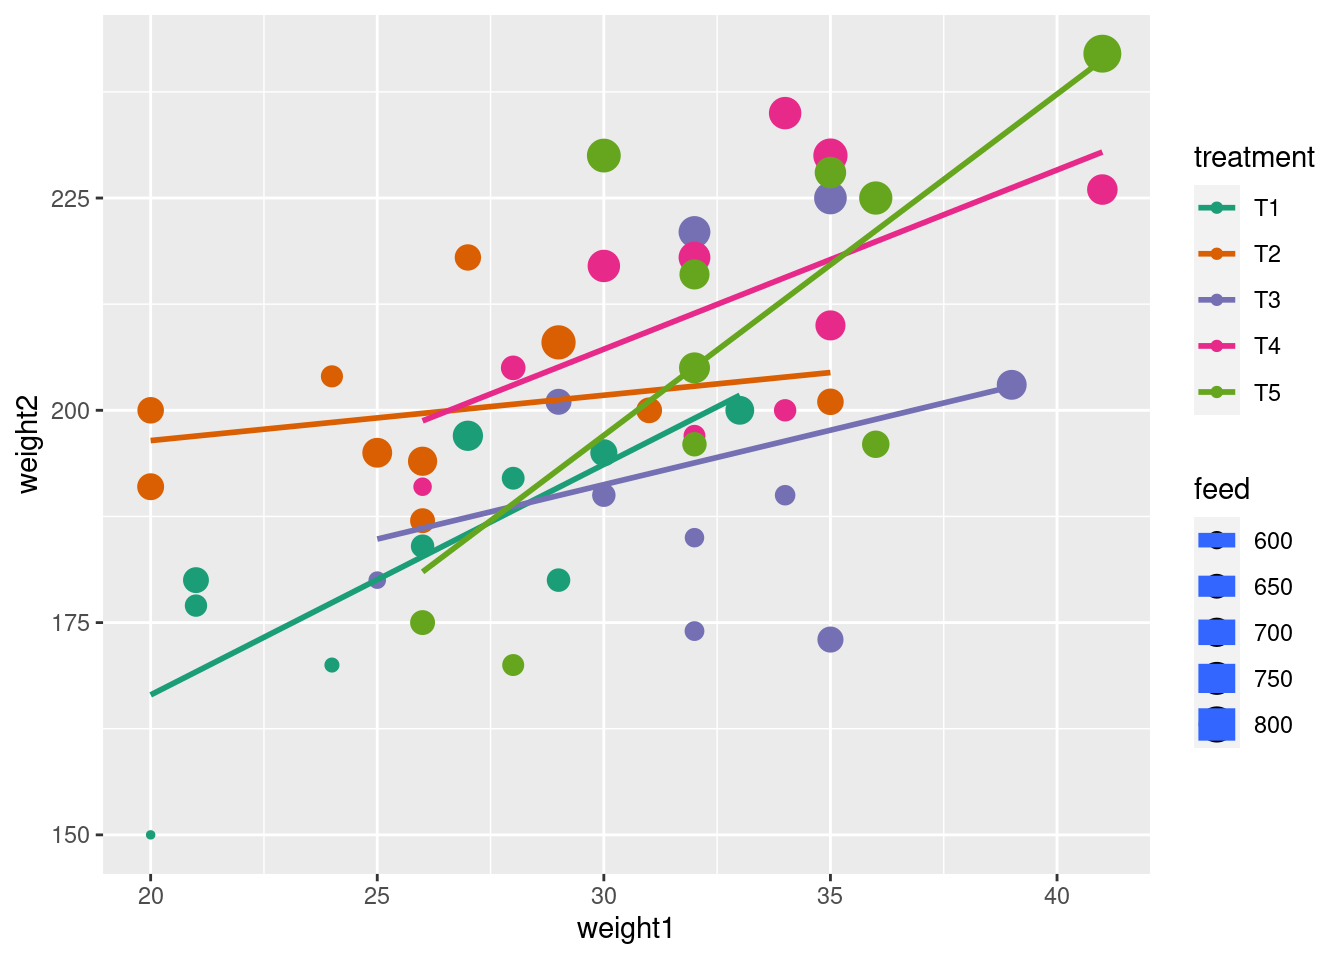
gfit <- gscatter + 
  geom_smooth(method = "lm", 
              formula = y ~ x,
              se = FALSE)
gfit
Warning: Using `size` aesthetic for lines was deprecated in ggplot2 3.4.0.
ℹ Please use `linewidth` instead.
Warning: The following aesthetics were dropped during statistical transformation: size
ℹ This can happen when ggplot fails to infer the correct grouping structure in
  the data.
ℹ Did you forget to specify a `group` aesthetic or to convert a numerical
  variable into a factor?

8.3 Coordinate system

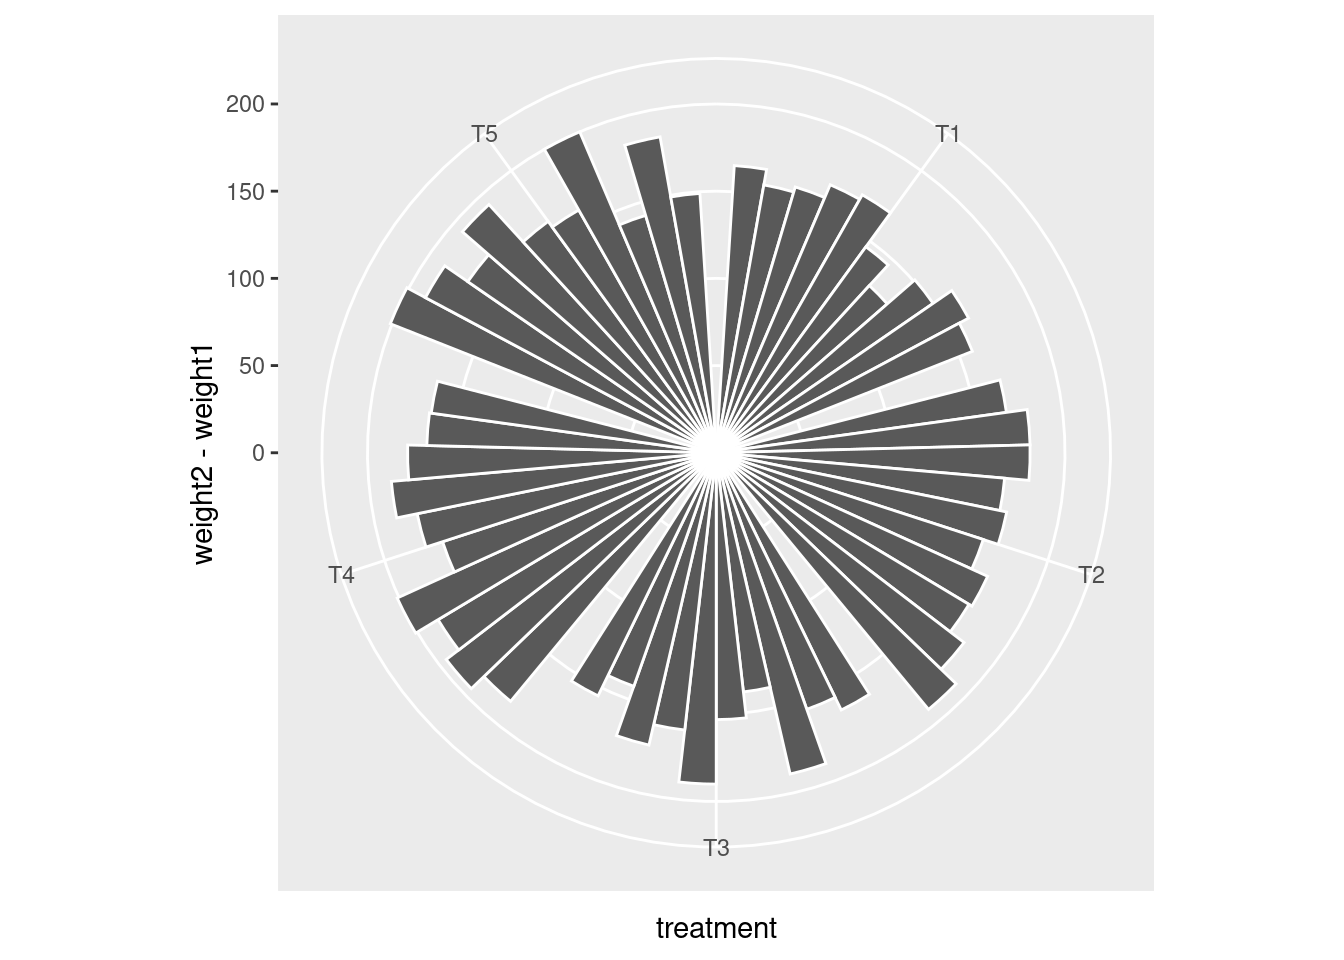
gbar <- ggplot(data = crampton.pig,
             mapping = aes(x = treatment,
                           y = weight2 - weight1,
                           group = factor(1:nrow(crampton.pig)))) +
        geom_col(position = "dodge", color = "white") 
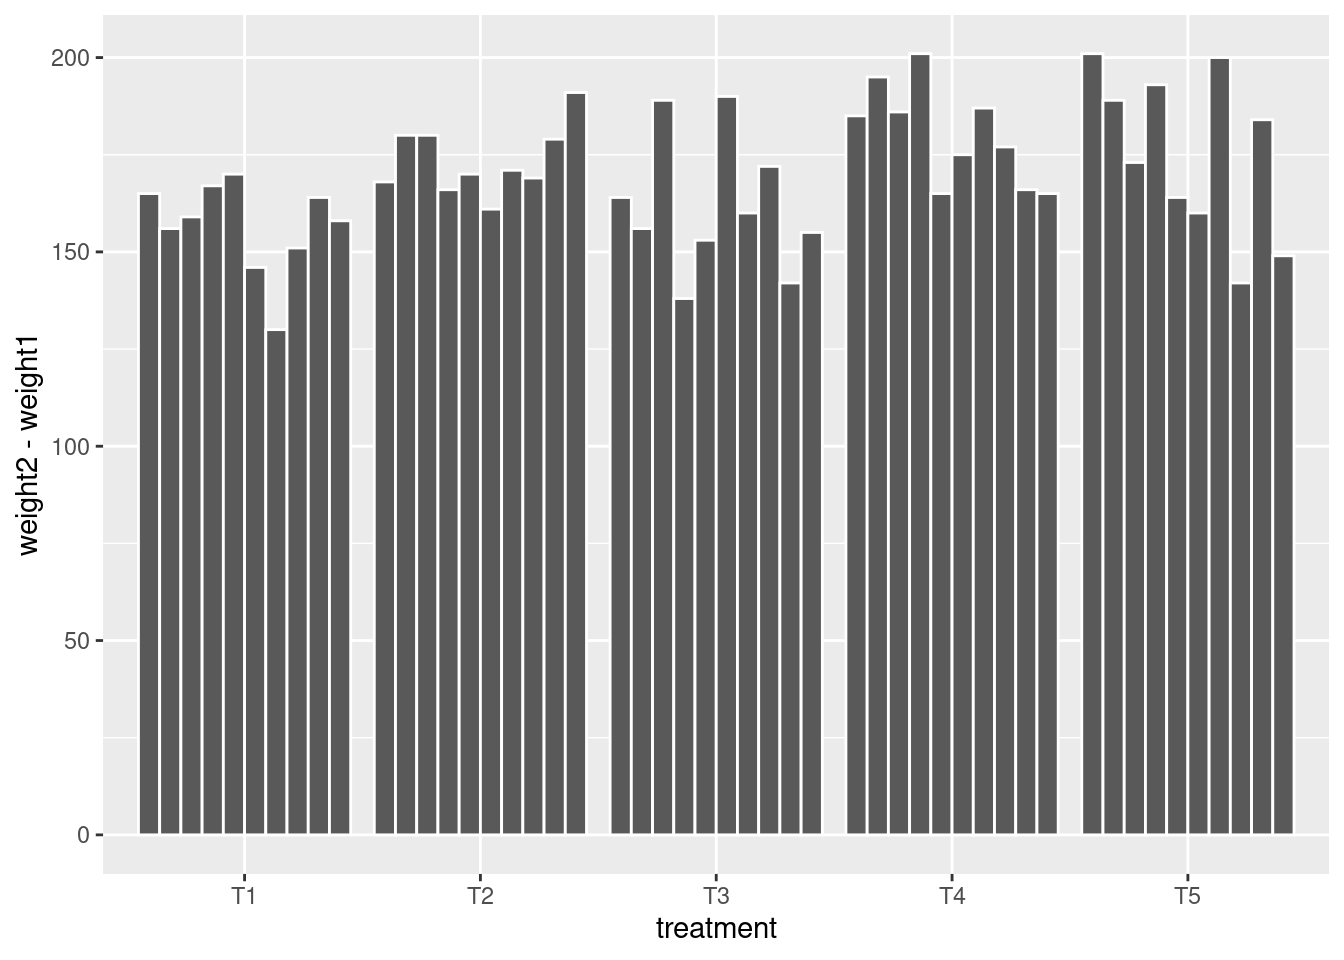
gbar

gbar + coord_polar("x")

8.4 Data organisation

crampton_pig_wide <- crampton.pig %>% 
  mutate(pig_id = 1:n()) %>% 
  pivot_longer(c(weight1, weight2), 
               names_to = "state",
               values_to = "weight")

glimpse(crampton_pig_wide)
Rows: 100
Columns: 6
$ treatment <fct> T1, T1, T1, T1, T1, T1, T1, T1, T1, T1, T1, T1, T1, T1, T1, …
$ rep       <fct> R1, R1, R2, R2, R3, R3, R4, R4, R5, R5, R6, R6, R7, R7, R8, …
$ feed      <int> 674, 674, 628, 628, 661, 661, 694, 694, 713, 713, 585, 585, …
$ pig_id    <int> 1, 1, 2, 2, 3, 3, 4, 4, 5, 5, 6, 6, 7, 7, 8, 8, 9, 9, 10, 10…
$ state     <chr> "weight1", "weight2", "weight1", "weight2", "weight1", "weig…
$ weight    <int> 30, 195, 21, 177, 21, 180, 33, 200, 27, 197, 24, 170, 20, 15…
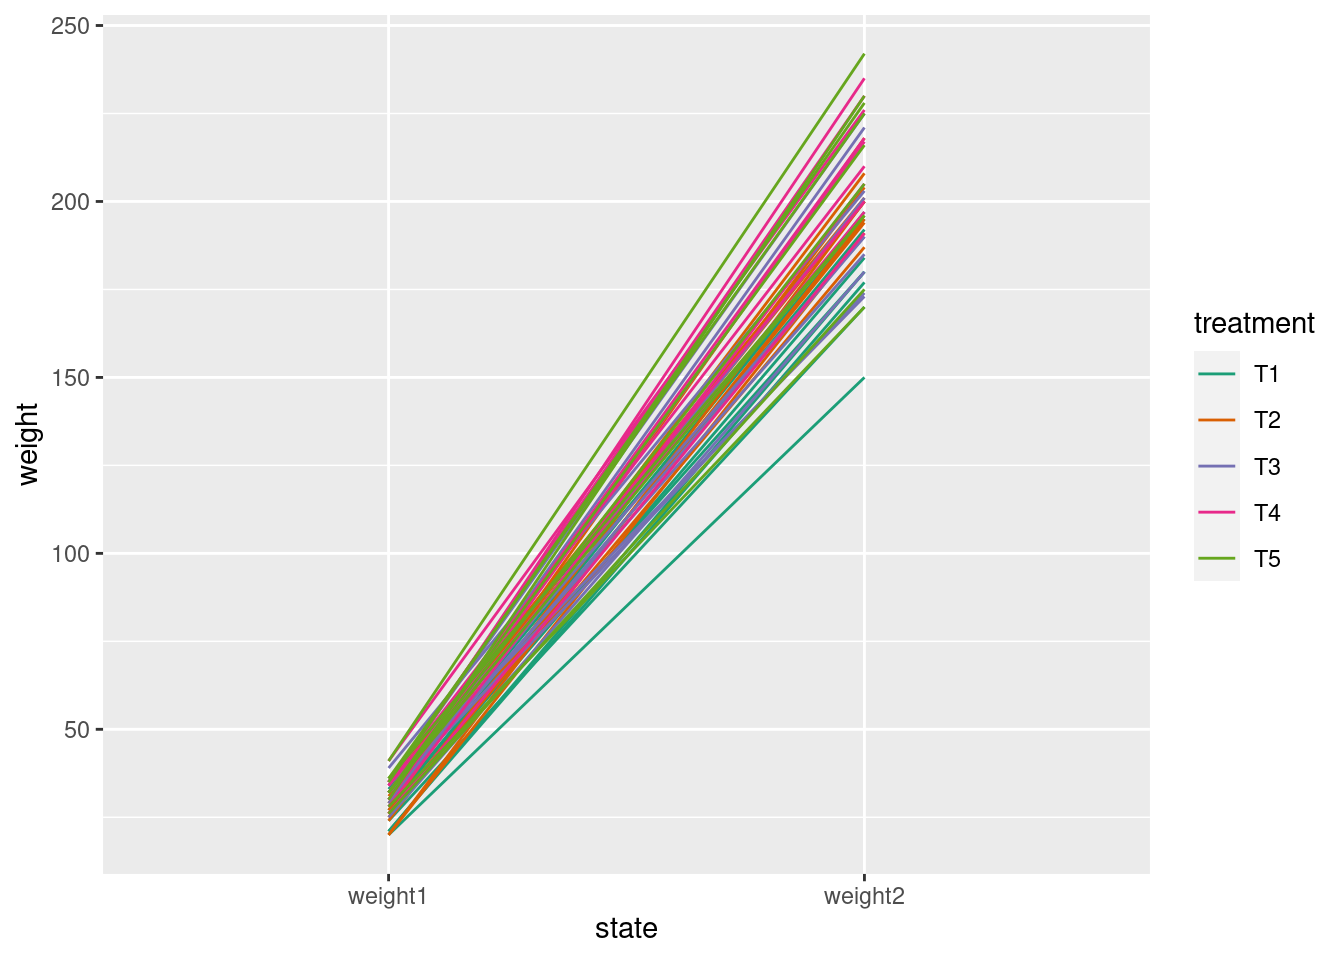
gslope <- ggplot(crampton_pig_wide, 
       aes(x = state, y = weight, group = pig_id)) +
  geom_line(aes(color = treatment))

gslope

8.5 Facet

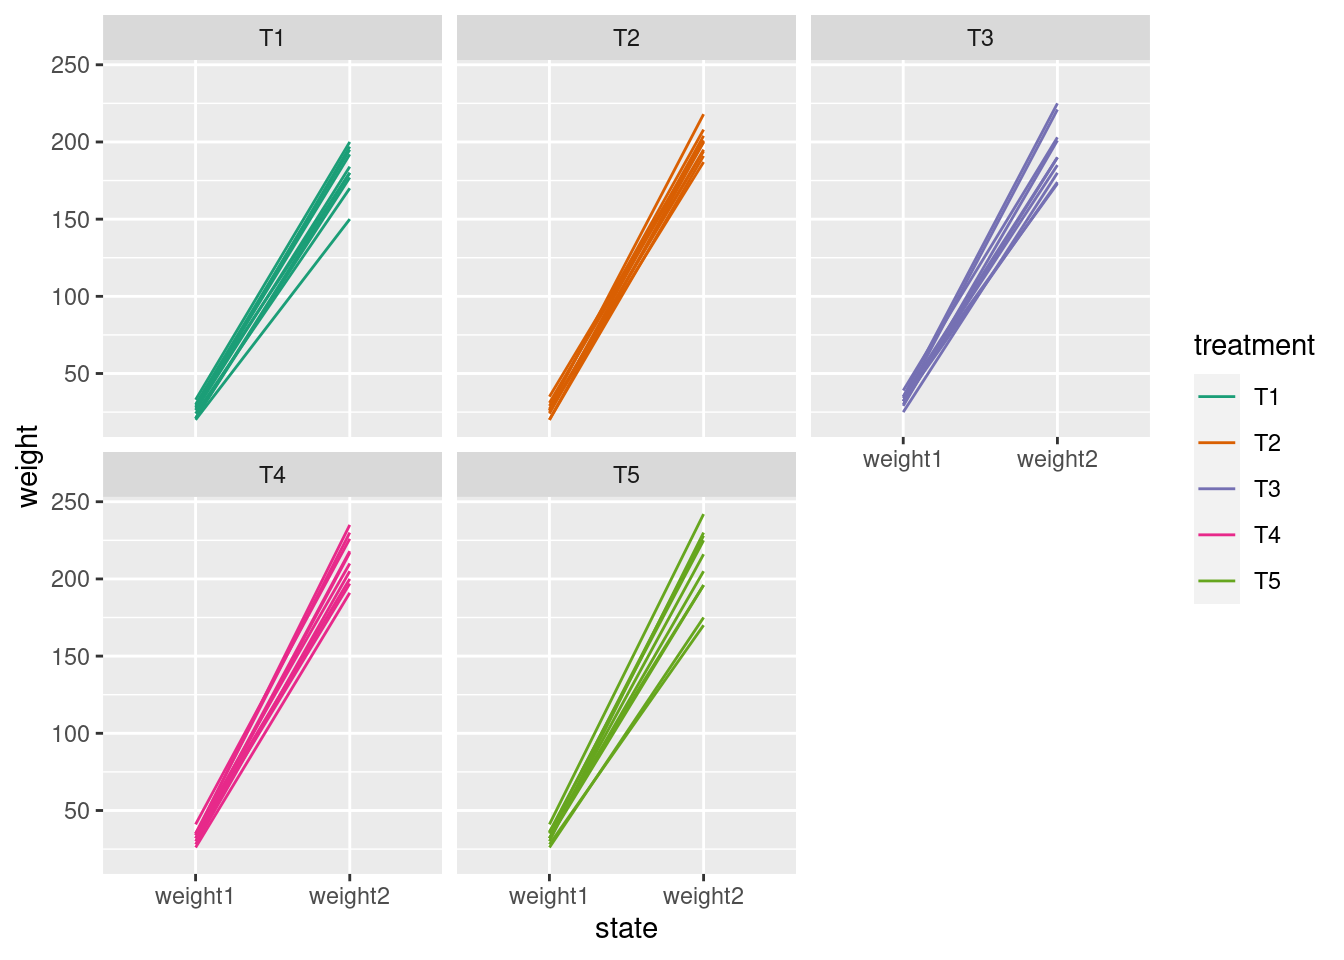
gslope + facet_wrap(~treatment)

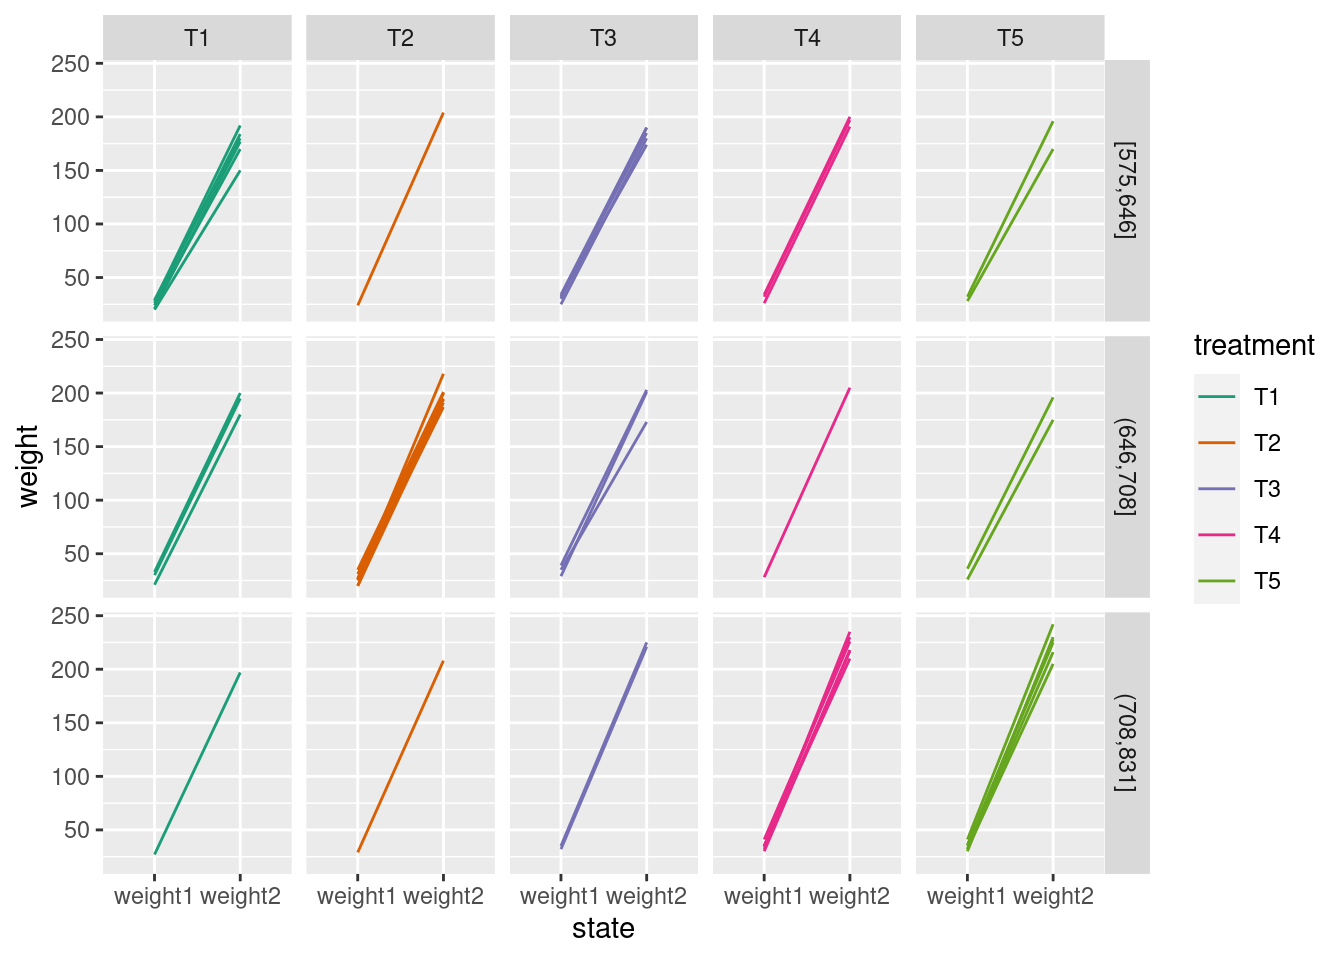
gslope + facet_grid(cut_number(feed, 3) ~ treatment)

8.6 Scale

8.7 Guide

8.8 Theme