Exploring Data from ANU Research Portal
The distribution of ANU researchers and the number of their publications across academic organisational units.
Data Source
The ANU Research Portal provides a list of researchers and their affiliations at ANU. From this portal, I extracted 2,370 profiles along with their affiliations and if available their Scopus ID on 8th June 2025 (what does one do over the King’s birthday long weekend otherwise…). After some cleaning, I subset to 1,880 profiles of ANU researchers who have either a Dr or Professor in their titles. The subsequent analysis are based on these profiles.
Warning
Note that:
- Not all ANU researchers have activated their research portal account and some information stored in it may be incorrect. For example, some profiles had no title and are removed from subsequent analysis.
- Some researchers are affiliated with multiple units and therefore counted multiple times in the analysis below.
Academic Organisational Units
Academic Colleges
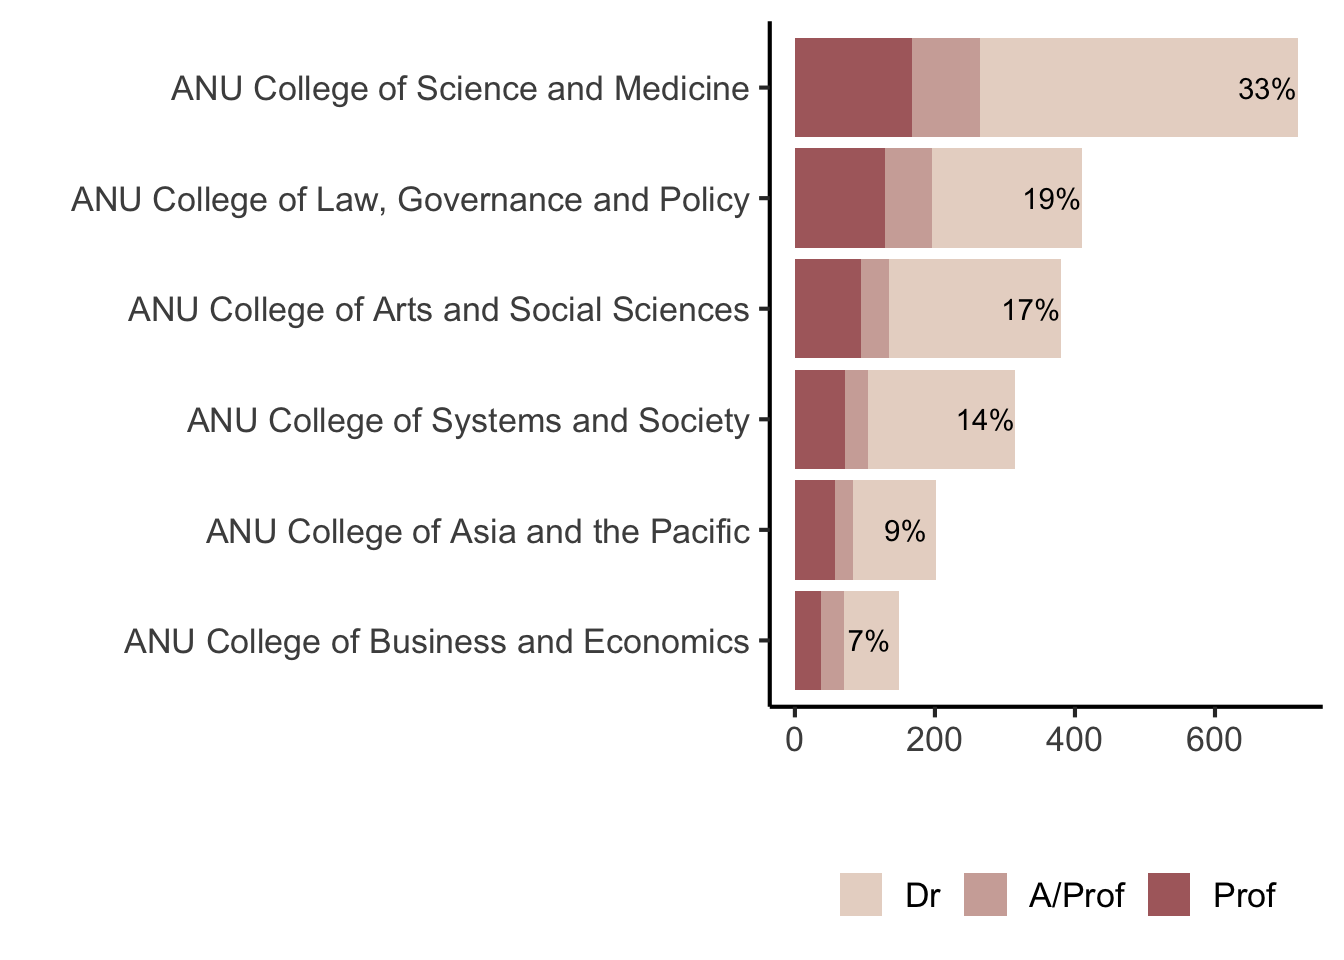
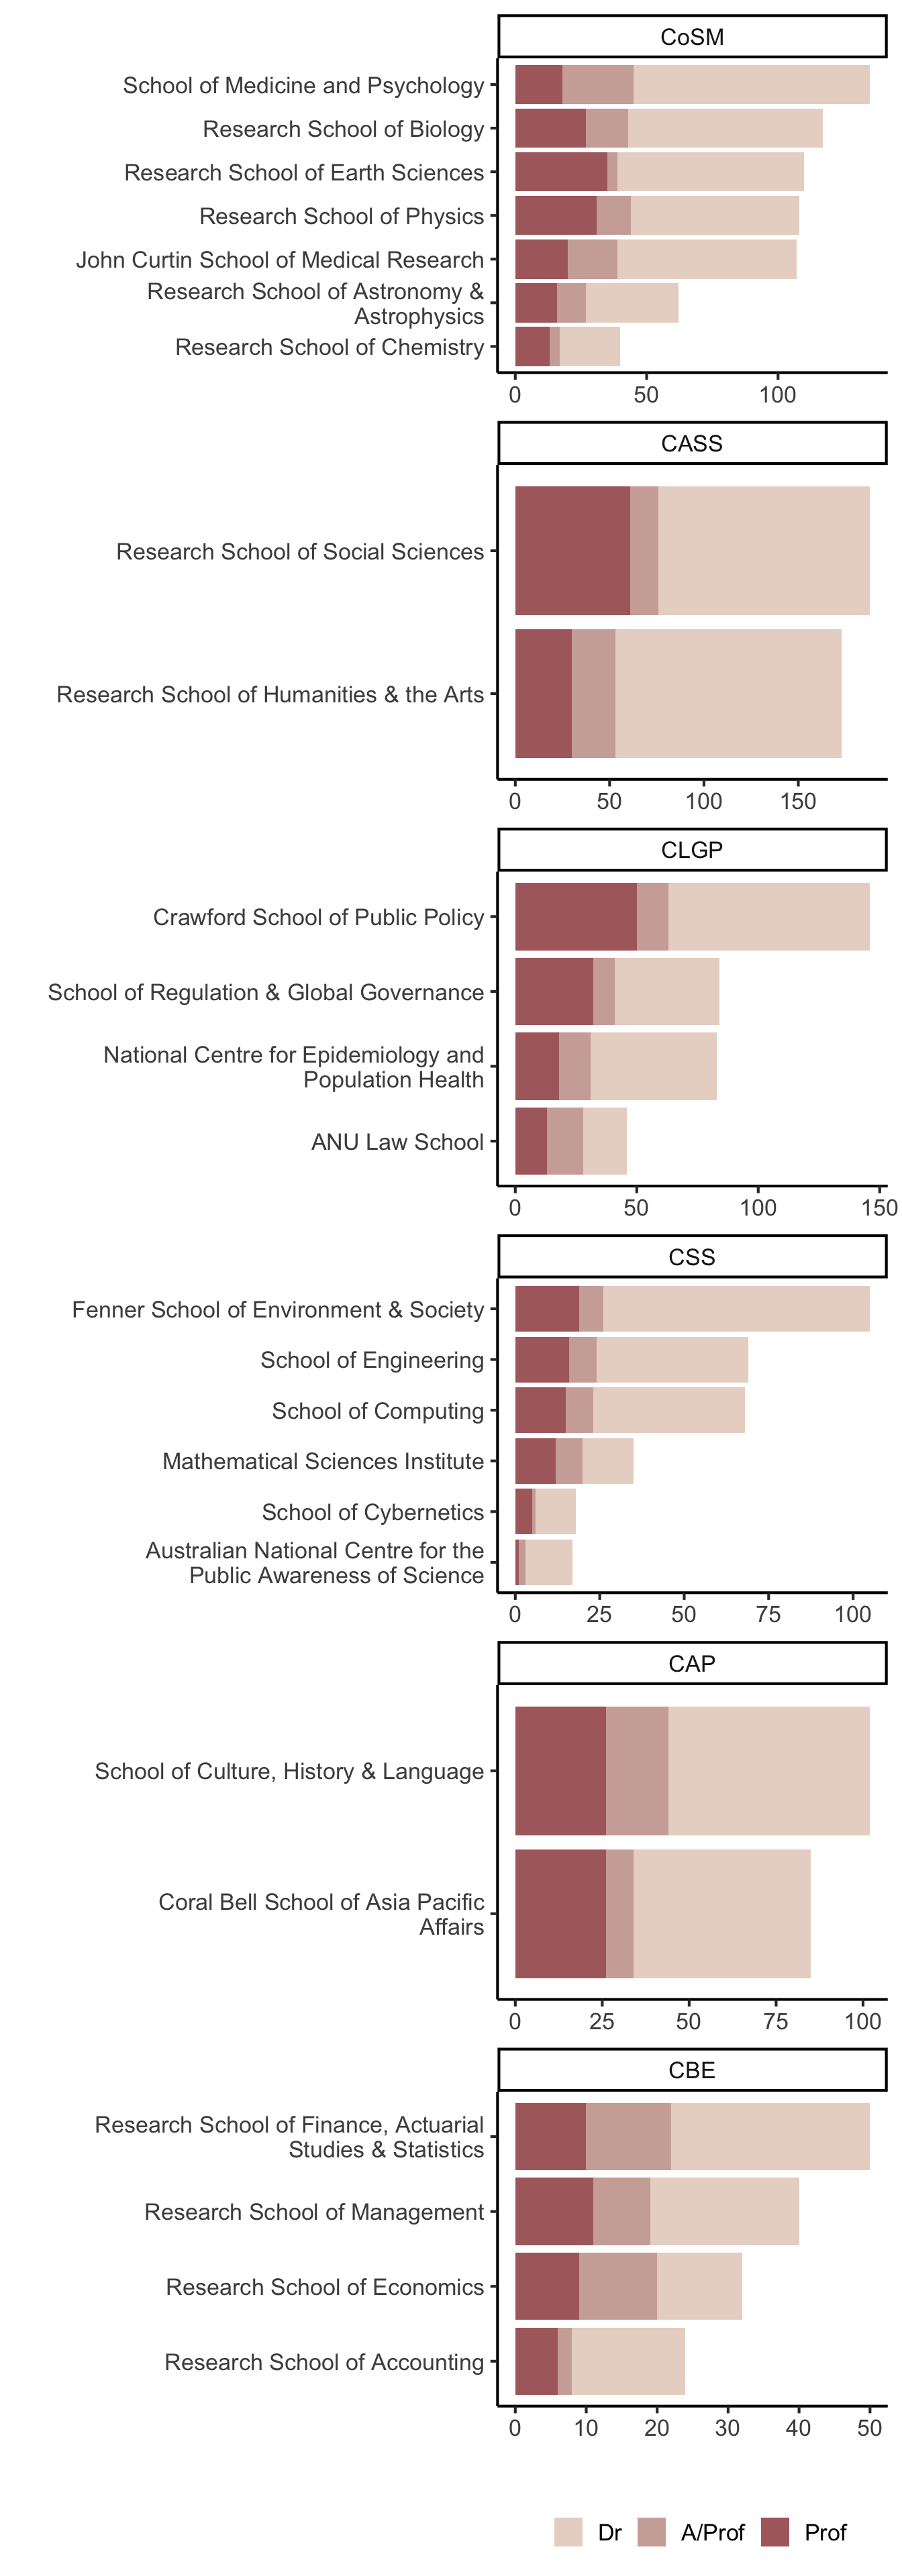
Figure 1 shows that the CoSM is considerably bigger relative to the other colleges. CBE, known for bringing the largest student revenue, is much smaller than I thought. Note that this does not count profiles who are not affiliated with Colleges.
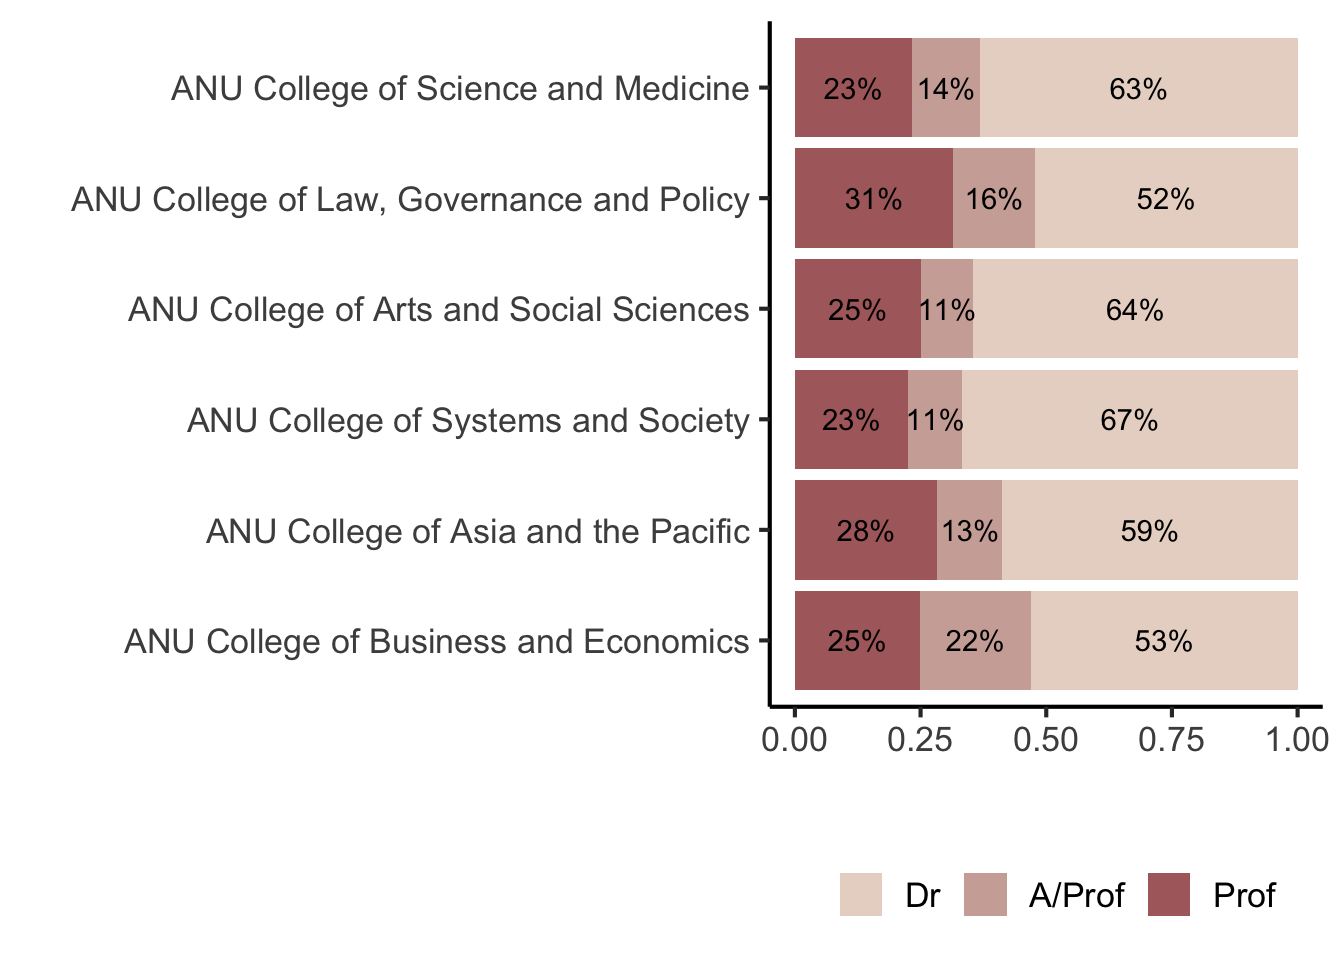
Figure 2 shows that CLGP is slightly top heavy compared to other colleges.
Schools and Centres
Figure 3 shows the breakdown of the ANU researchers by their School or Centre. School of Medicine and Psychology is bigger than I realised! RSE is quite top heavy compared to other schools in CoSM.
College of Arts and Social Science
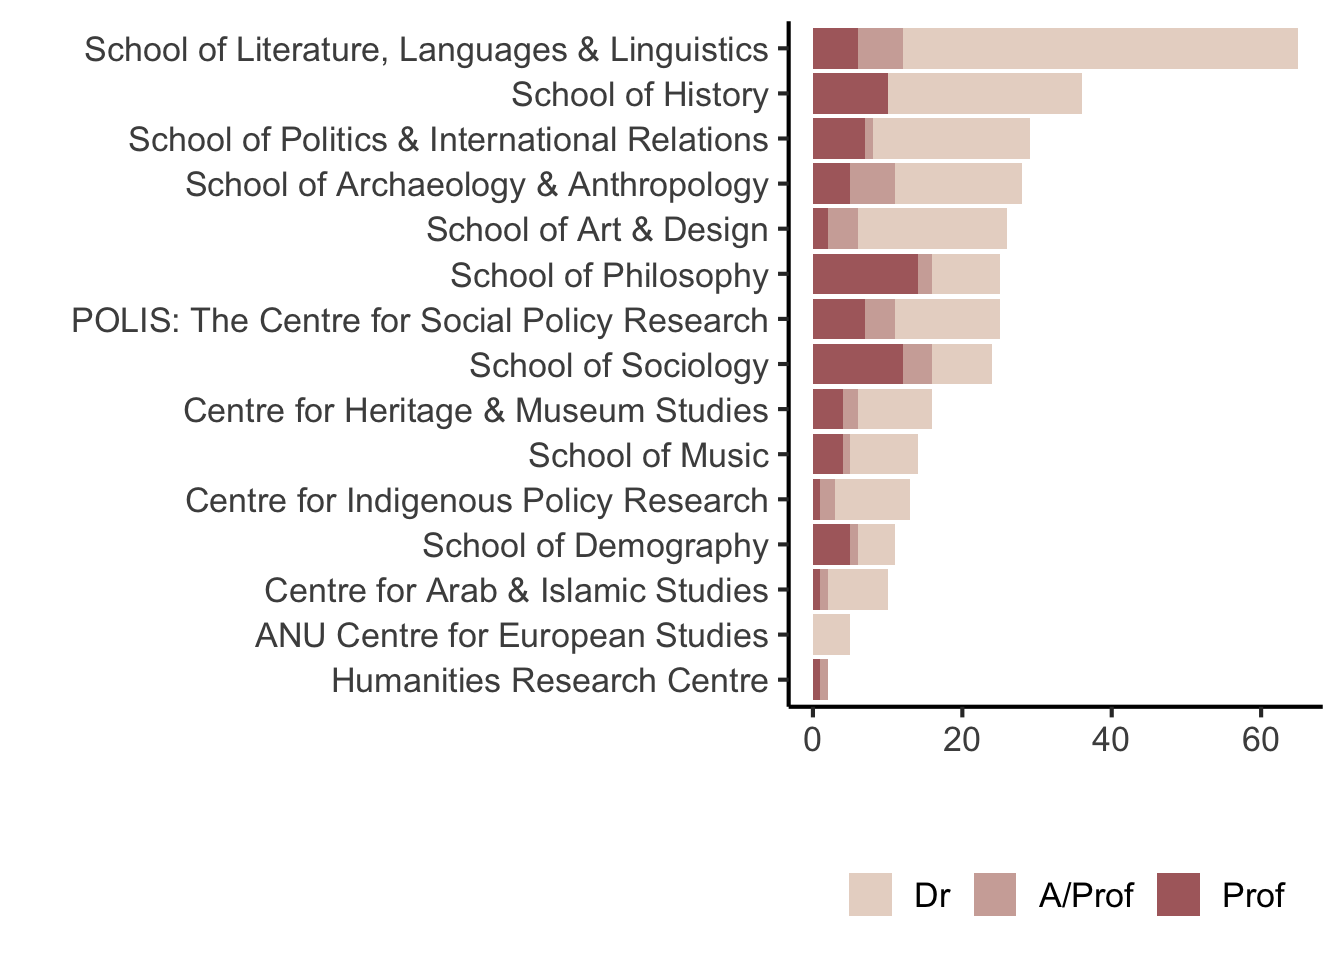
We’ll have a special look at CASS given that it’s also got another breakdown into smaller schools (Figure 4). Now I don’t claim to understand what these smaller school structures mean. It’s possible that some staff belong to multiple schools. I haven’t delved into that aspect.
Research School of Biology
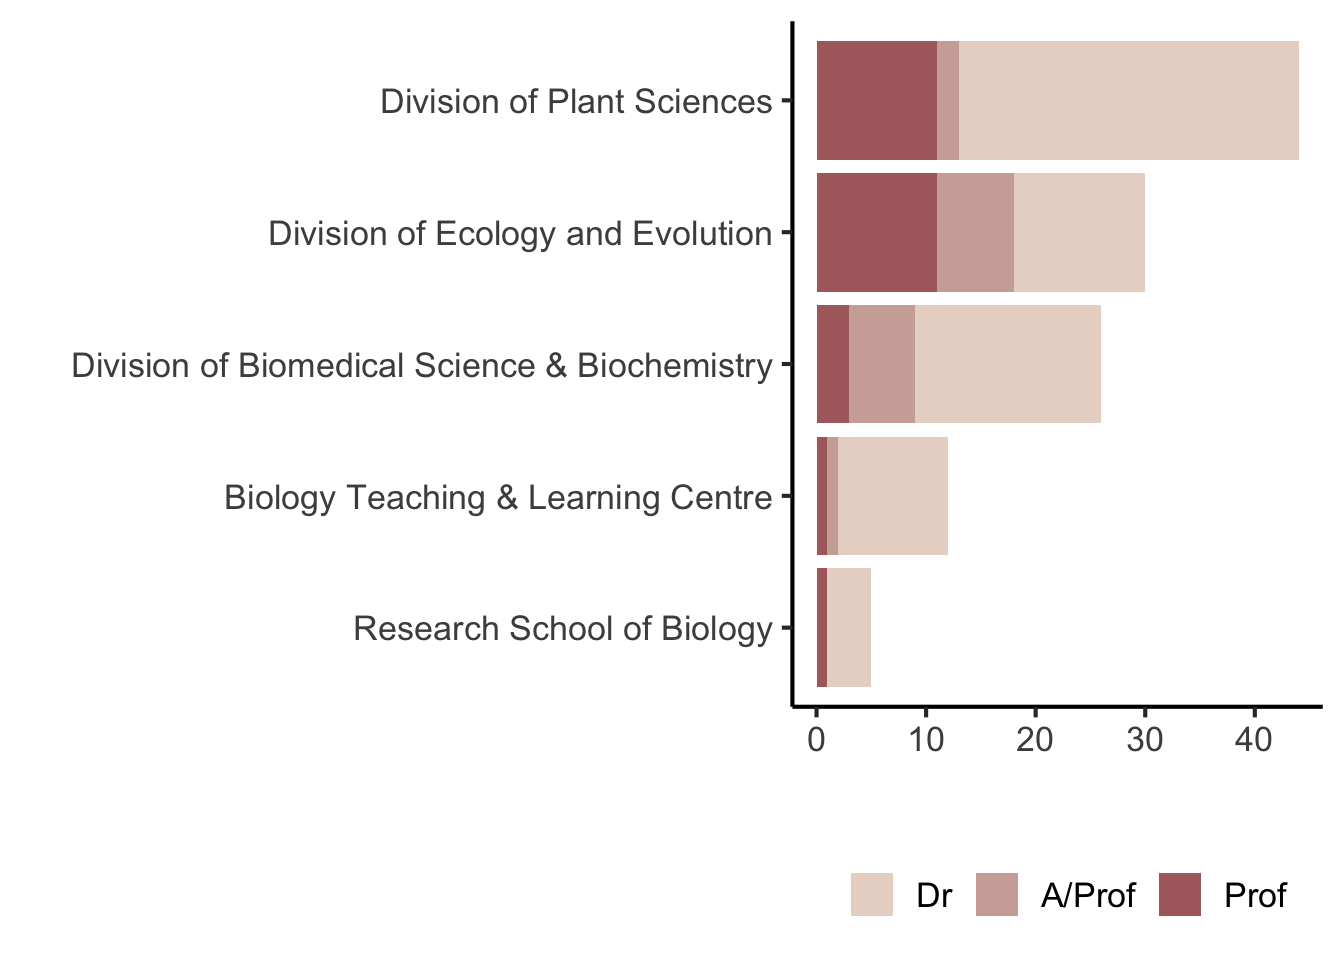
From personal interest, I also looked at the RSB (Figure 5) which is part of CoSM. The Division of Plant Sciences is the largest group within RSB. This strength is perhaps reflected in the fact that it also houses the Australian Plant Phenomics Network, ARC Training Centre for Future Crops Development and more recently, ARC Training Centre in Plant Biosecurity .
Publications
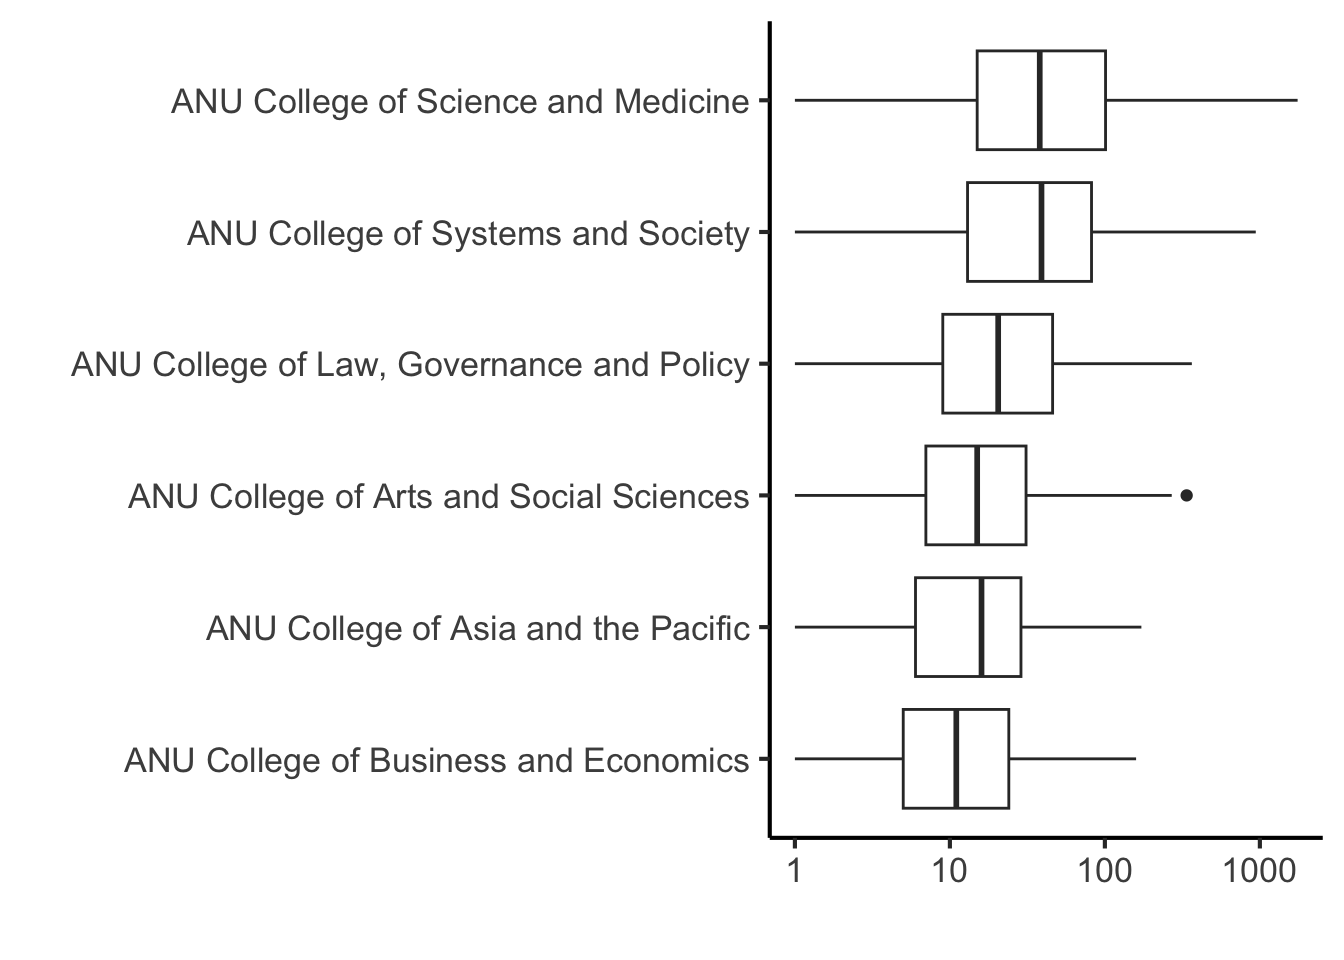
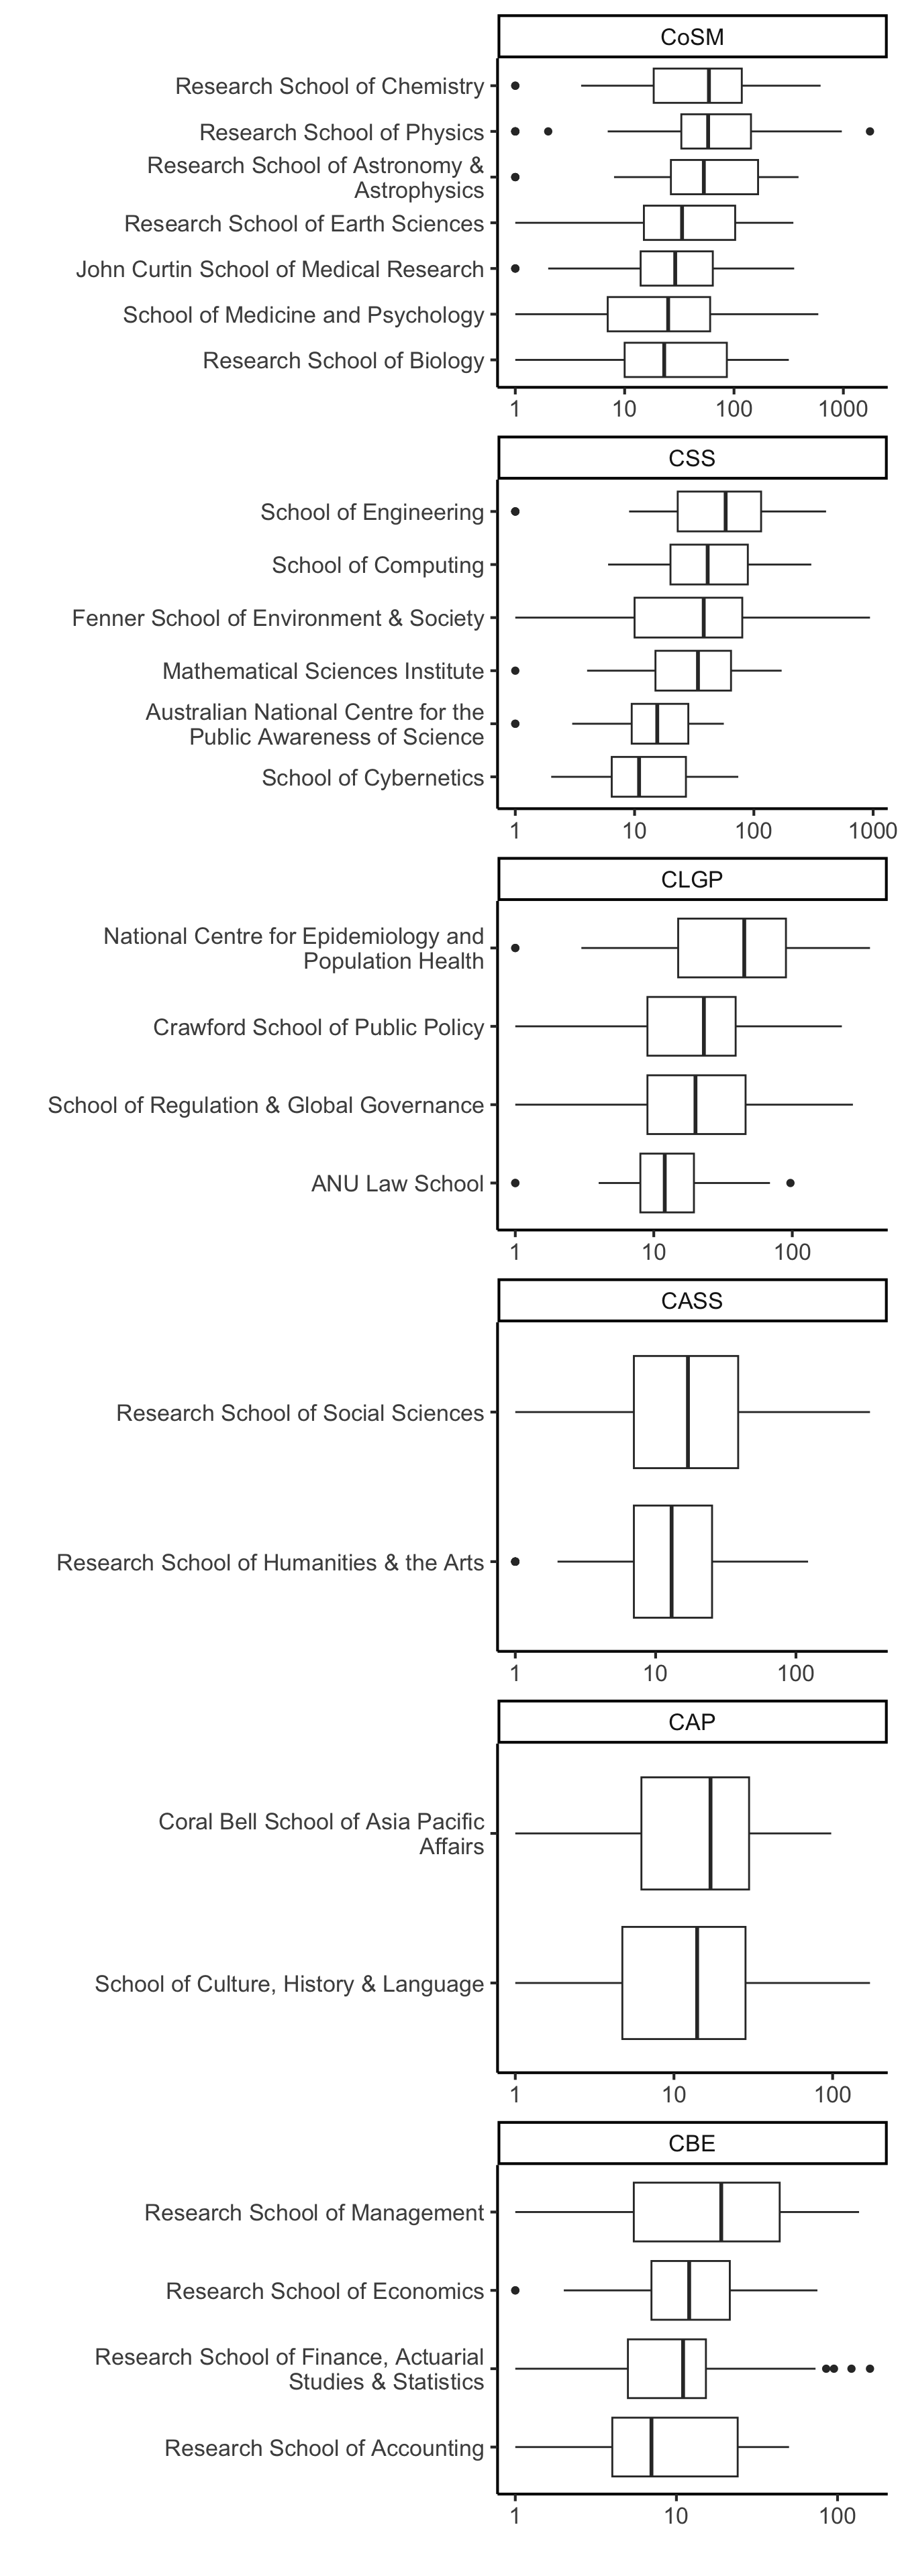
Of the 1,880 ANU researcher profiles who have either a Dr or Professor in their titles 1,658 have a Scopus ID in their profile. Every discipline has their own publication culture so this information shouldn’t be used to judge the research worth of any discipline.
Figure 6 and Figure 7 show the distribution of the number of publications by ANU researchers across Colleges and Schools/Centres, respectively. The number of publications is highly skewed, with some researchers having more than 1000 publications. The boxplots are shown on a log scale to better visualise the distribution.