ETC3250/5250

Introduction to Machine Learning

Wrap-up

Lecturer: Emi Tanaka

Department of Econometrics and Business Statistics


  • emi.tanaka@monash.edu
  • Week 12B


Toyota car price

Predict the Toyota car price from this used car listing data.

Code
library(tidyverse)
toyota <- read_csv("https://emitanaka.org/iml/data/toyota.csv")

Medical insurance costs

Predict the insurance charges given customer characteristics from this data.

Code
insurance <- read_csv("https://emitanaka.org/iml/data/insurance.csv")

Breast cancer diagnosis

Diagnose (diagnosis) a breast mass sample as malignant (M) or benign (B) from the features of its image using Wisconsin breast cancer data set.

Code
cancer <- read_csv("https://emitanaka.org/iml/data/cancer.csv") %>% 
  mutate(diagnosis_malignant = ifelse(diagnosis=="M", 1, 0),
         diagnosis = factor(diagnosis, levels = c("B", "M"))) %>% 
  janitor::clean_names()

Titanic survival

scroll

Predict whether the titanic passenger survived from class, sex and age.

Code
titanic <- datasets::Titanic %>% 
  as.data.frame() %>% 
  pivot_wider(c(Class, Sex, Age), 
              names_from = Survived, 
              values_from = Freq, 
              names_prefix = "Survived_")

Digit recognition with MNIST database

Predict digit 0-9 (label) from a 28\times 28 (784 pixels) image.

Code
dat_mnist <- dslabs::read_mnist()
mnist <- dat_mnist$train$images %>% 
  as.data.frame() %>% 
  mutate(label = as.factor(dat_mnist$train$label))

Bank marketing data

Predict whether client will subscribe to a term deposit (y) based on direct marketing campaigns of a Portuguese banking institution.

Code
bank <- read_delim("https://emitanaka.org/iml/data/bank-full.csv", delim = ";")

Sales of insurance policy

Predict whether the customer will Purchase a caravan insurance policy based on data here.

Code
caravan <- read_csv("https://emitanaka.org/iml/data/caravan.csv") %>% 
  mutate(across(-Purchase, scale),
         Purchase = factor(Purchase))

Customer survey data

Learn about customer personalities from a customer survey data.

Code
marketing <- read_tsv("https://emitanaka.org/iml/data/marketing_campaign.csv")

marketing_clean <- marketing %>% 
  mutate(Marital_Status = fct_collapse(
    Marital_Status,
    "1" = c("Absurd", "Alone", "Divorced", "Single",
            "Widow", "YOLO"),
    "2" = c("Married", "Together")
  ), 
  Marital_Status = as.numeric(as.character(Marital_Status)),
  Education = fct_collapse(
    Education,
    "3" = c("2n Cycle", "Master", "PhD"),
    "1" = "Basic",
    "2" = "Graduation"
  ),
  Education = as.numeric(as.character(Education)),
  Income = case_when(is.na(Income) ~ 0,
                     Income == 666666 ~ 0,
                     TRUE ~ Income),
  Dt_Customer = year(dmy(Dt_Customer)) - 2011) %>% 
  filter(Year_Birth >= 1940) %>% 
  mutate(Age = 2015 - Year_Birth) %>% 
  select(-Year_Birth)

Yale face database

Profile the faces from the yale face database (Belhumeur et al. 1997).
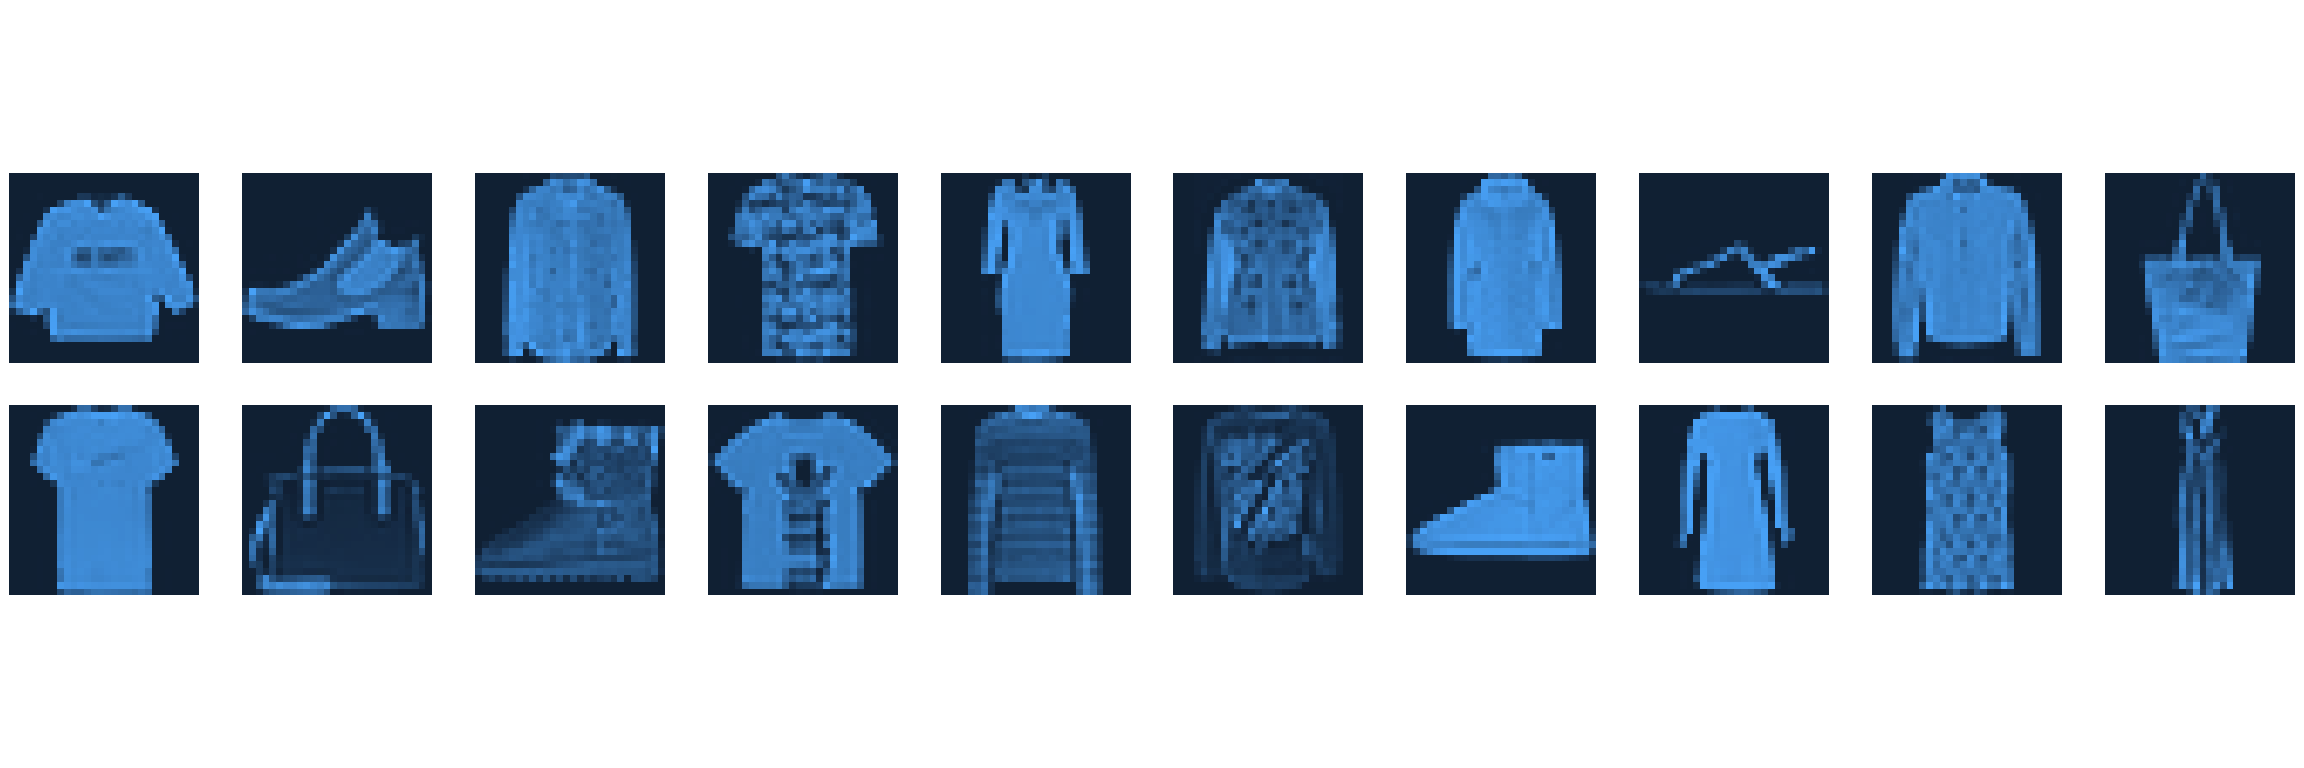
Code
yalefaces <- read_csv("https://emitanaka.org/iml/data/yalefaces.csv")

Wine quality data

Investigate wine quality based on several features of wines based on this data.

Code
wine <- read_csv("https://emitanaka.org/iml/data/winequalityN.csv")

Fashion MNIST data

Predict the clothe type (labelled 0-9) from a 28\times 28 (784 pixel) image using the fashion MNIST data by Zalando SE.

Code
fashion <- read_csv("https://emitanaka.org/iml/data/fashion-mnist_train.csv.gz")

Toolkit

Supervised learning

We cover the following methods:

  • Regression problems:
    • Linear & non-linear regression:
      • Parameteric
      • Non-parametric
    • Regression trees
    • Tree-ensemble methods
    • k-nearest neighbours (k-NN)
    • Neural networks
  • Classification problems:
    • Logistic regression
    • Linear & quadratic discriminant analysis (LDA & QDA)
    • Classification trees
    • Tree-ensemble methods
    • k-nearest neighbours (k-NN)
    • Support vector machines (SVM)
    • Neural networks

Unsupervised learning

We cover the following methods:

  • Dimension reduction:
    • multi-dimensional scaling (MDS)
    • principle component analysis (PCA)
  • Clustering:
    • hierarchical
    • k-means

Workflow

  • Resampling:
    • Training, testing and validation data splits
    • k-fold cross-validation
    • Bootstrap samples
    • Nested cross-validation
  • Data preprocessing:
    • Converting categorical variable to dummy variables (one-hot encoding)
    • Standardising variables

Other toolkits

  • Regularisation:
    • L1 regularisation (lasso)
    • L2 regularisation (ridge regression)
    • L1 and L2 regularisation (elastic net)
  • Miscellaneous techniques:
    • Splines
    • Variable selection
    • Feature engineering

Critical thinking

Problem identification

  • Before using your toolkits, you need to be able to formulate the aim and problem.
  • Is the aim prediction or inference?
  • Do you apply a supervised learning or unsupervised learning (or neither)?
  • If supervised learning, is it a regression, binary classification or multi-class classification?
  • Are there any issues with the data? E.g. missing values, non-representative data, ethical issues, etc.
  • We conveniently side-stepped issues with the data most of the time but in practice you should be mindful of these problems.

This unit and beyond

Learning more

If you liked this unit (and did well), you may like to consider enrolling for the next semester:

ETC3555/ETC5555 - Statistical Machine Learning

This unit covers the methods and practice of statistical machine learning for modern data analysis problems. Topics covered will include recommender systems, social networks, text mining, matrix decomposition and completion, and sparse multivariate methods. All computing will be conducted using the R programming language.

Prerequisites: ETC3250/ETC5250 or FIT3154

Exam information

scroll

  • There are a total of 25 questions comprising of:
    • 10 multiple choice questions (with a single answer),
    • 15 short to long answer questions.
  • This is a supervised eAssessment comprising a mix of computer input and handwritten responses – be prepared to take photo and upload handwritten responses at the end of the exam. Please label question number in handwritten responses.
  • Total time: 2 hours and 10 minutes.
  • Content:
    • Week 1-12 inclusive.
    • No questions asks you to write R code but you will need to understand some R code and output.
    • No questions with mathematical proofs.
    • A few questions asking you to explain about concepts or models.
    • See sample exam on Moodle.
  • Bring:
    • Notes (either printed or handwritten) on double-sided A4 paper allowed – note: no equation sheet provided in the exam so write this in your notes if you need it.
    • Calculator.

Good luck!