Lecturer: Emi Tanaka
Department of Econometrics and Business Statistics
Aim
Image from Spencer (2022, Feb. 17). Data in Wonderland. Retrieved from https://ssp3nc3r.github.io/data_in_wonderland
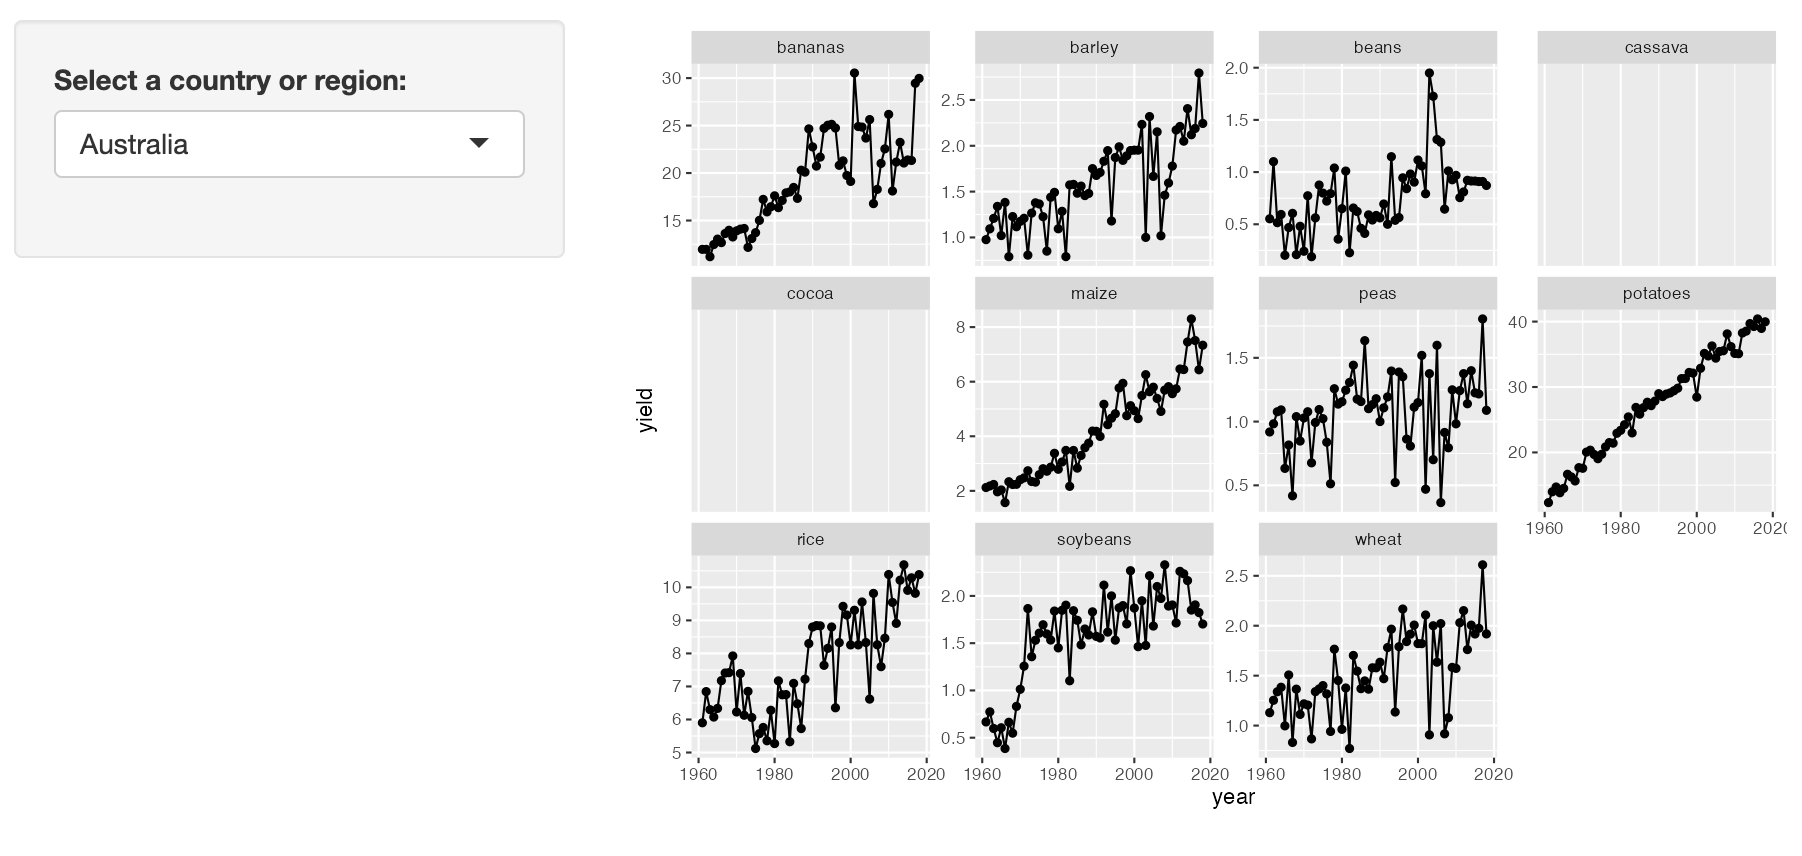
d3.js
and stack.gl
(open software ecosystem for WebGL).library(ggplot2) g <- ggplot(ggplot2::diamonds, aes(x = cut, fill = clarity)) + geom_bar(position = "dodge") + scale_fill_brewer(palette = "Accent") ggplotly(g)
library(ggplot2) g <- ggplot(ggplot2::diamonds, aes(x = cut, fill = clarity)) + geom_bar(position = "dodge") + scale_fill_brewer(palette = "Accent") ggplotly(g)
yields <- na.omit(cwdata::key_crop_yields) crops <- sort(unique(yields$crop)) map(crops, ~ { yields %>% filter(crop == .x) %>% plot_ly( x = ~ year, y = ~ yield, type = 'scatter', mode = 'lines', color = ~ crop, transforms = list( list( type = 'filter', target = ~ entity, operation = '=', value = "Afghanistan" ) ) ) }) %>% subplot(nrows = 3) %>% layout( showlegend = FALSE, annotations = imap(crops, ~ { list( x = 0 + 1 / 4 * (.y - 1) - 1 / 4 * 4 * (.y > 4) - 1 / 4 * 4 * (.y > 8), y = 1 - 0.05 - 1 / 3 * (.y > 4) - 1 / 3 * (.y > 8) , font = list(size = 18), text = .x, xref = "paper", yref = "paper", xanchor = "center", yanchor = "bottom", showarrow = FALSE ) }), updatemenus = list(list( type = 'dropdown', active = 0, buttons = map( unique(yields$entity), ~ list( method = "restyle", args = list("transforms[0].value", .x), label = .x ) ) )) )
library(shiny) library(ggplot2) library(dplyr) library(cwdata) ui <- fluidPage( br(), sidebarLayout( sidebarPanel( selectizeInput("entity", "Select a country or region:", choices = sort(unique(key_crop_yields$entity)), selected = "Australia") ), mainPanel( plotOutput("tsplot") ) ) ) server <- function(input, output, session) { output$tsplot <- renderPlot({ key_crop_yields %>% filter(entity == input$entity) %>% ggplot(aes(year, yield)) + geom_line() + geom_point() + facet_wrap(~crop, scale = "free_y") }) } shinyApp(ui, server)
Summary
Resources
Sievert (2019) Interactive web-based data visualization with R, plotly, and shiny
Shneiderman (2003) The Eyes Have It: A Task by Data Type Taxonomy for Information Visualizations. The Craft of Information Visualization: Readings and Reflections
ETC5523 Week 12