| x1 | x2 | x3 | x4 | y1 | y2 | y3 | y4 |
|---|---|---|---|---|---|---|---|
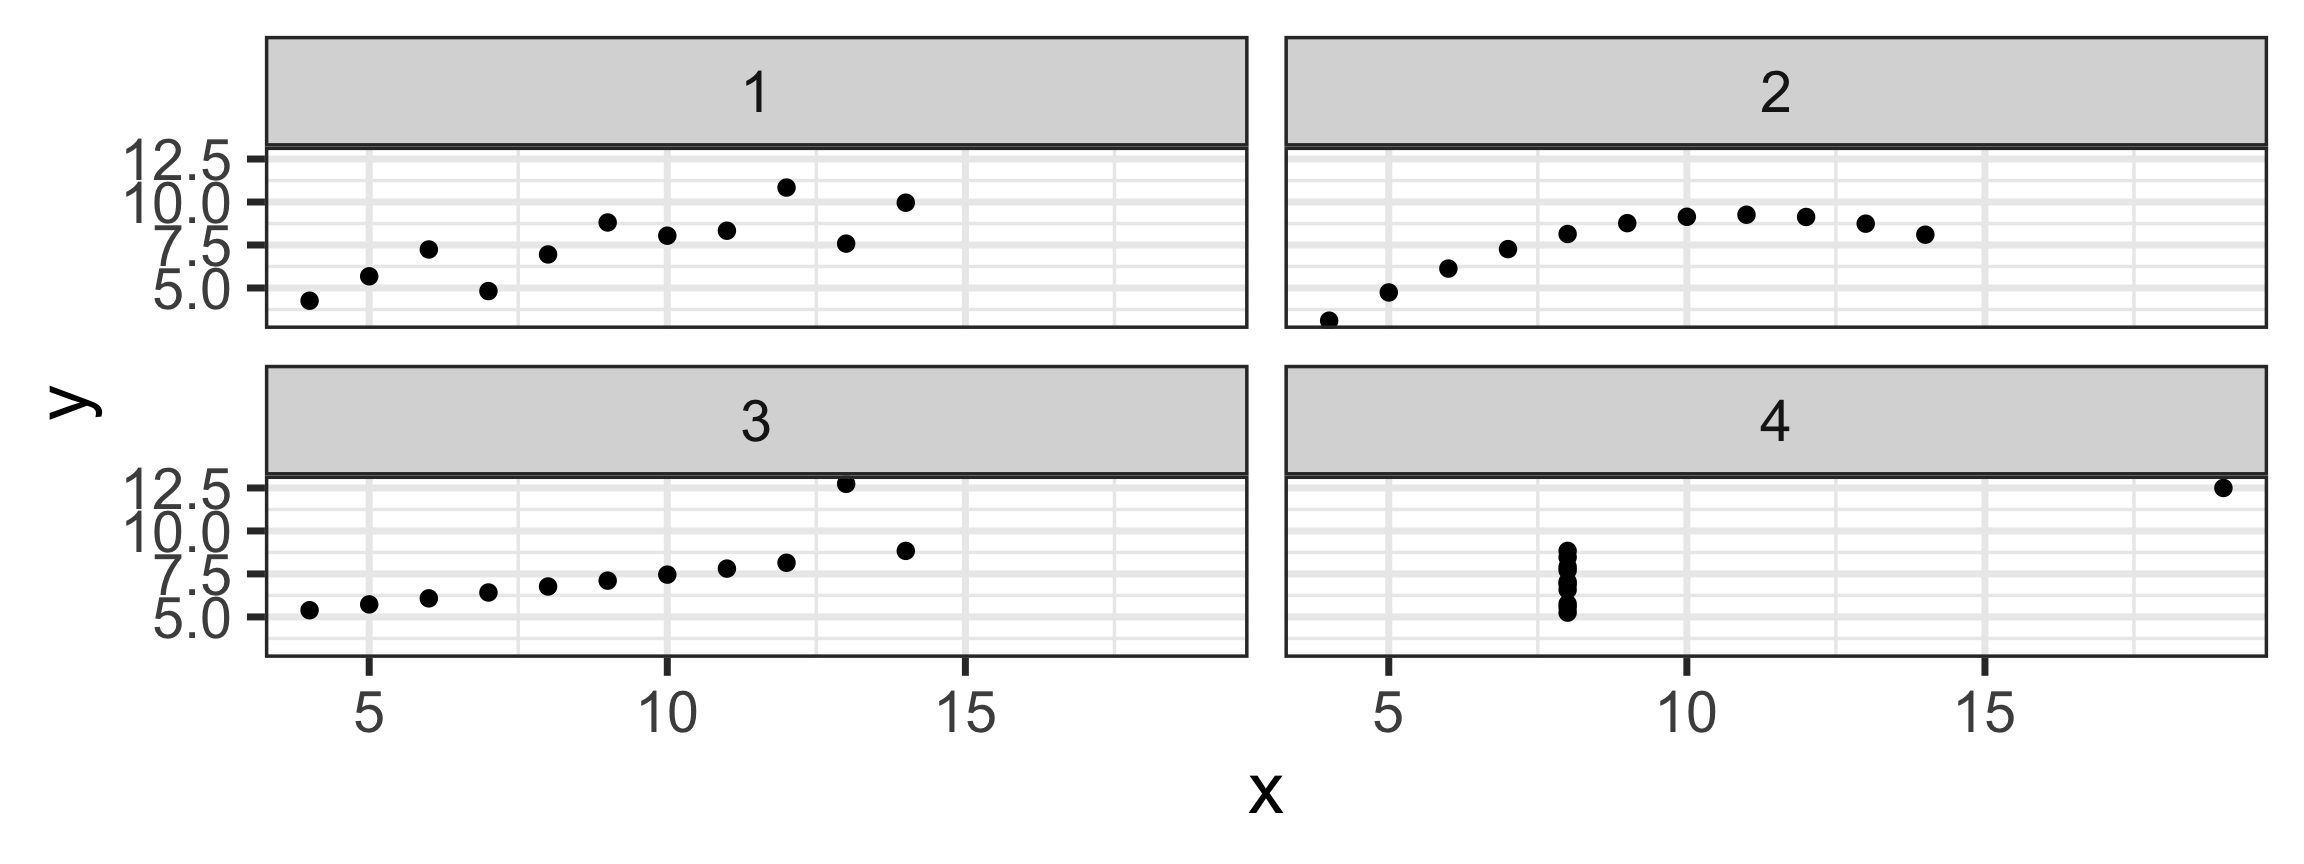
| 10 | 10 | 10 | 8 | 8.04 | 9.14 | 7.46 | 6.58 |
| 8 | 8 | 8 | 8 | 6.95 | 8.14 | 6.77 | 5.76 |
| 13 | 13 | 13 | 8 | 7.58 | 8.74 | 12.74 | 7.71 |
| 9 | 9 | 9 | 8 | 8.81 | 8.77 | 7.11 | 8.84 |
| 11 | 11 | 11 | 8 | 8.33 | 9.26 | 7.81 | 8.47 |
| 14 | 14 | 14 | 8 | 9.96 | 8.10 | 8.84 | 7.04 |
| 6 | 6 | 6 | 8 | 7.24 | 6.13 | 6.08 | 5.25 |
| 4 | 4 | 4 | 19 | 4.26 | 3.10 | 5.39 | 12.50 |
| 12 | 12 | 12 | 8 | 10.84 | 9.13 | 8.15 | 5.56 |
| 7 | 7 | 7 | 8 | 4.82 | 7.26 | 6.42 | 7.91 |
| 5 | 5 | 5 | 8 | 5.68 | 4.74 | 5.73 | 6.89 |
Anscombe’s Quartet
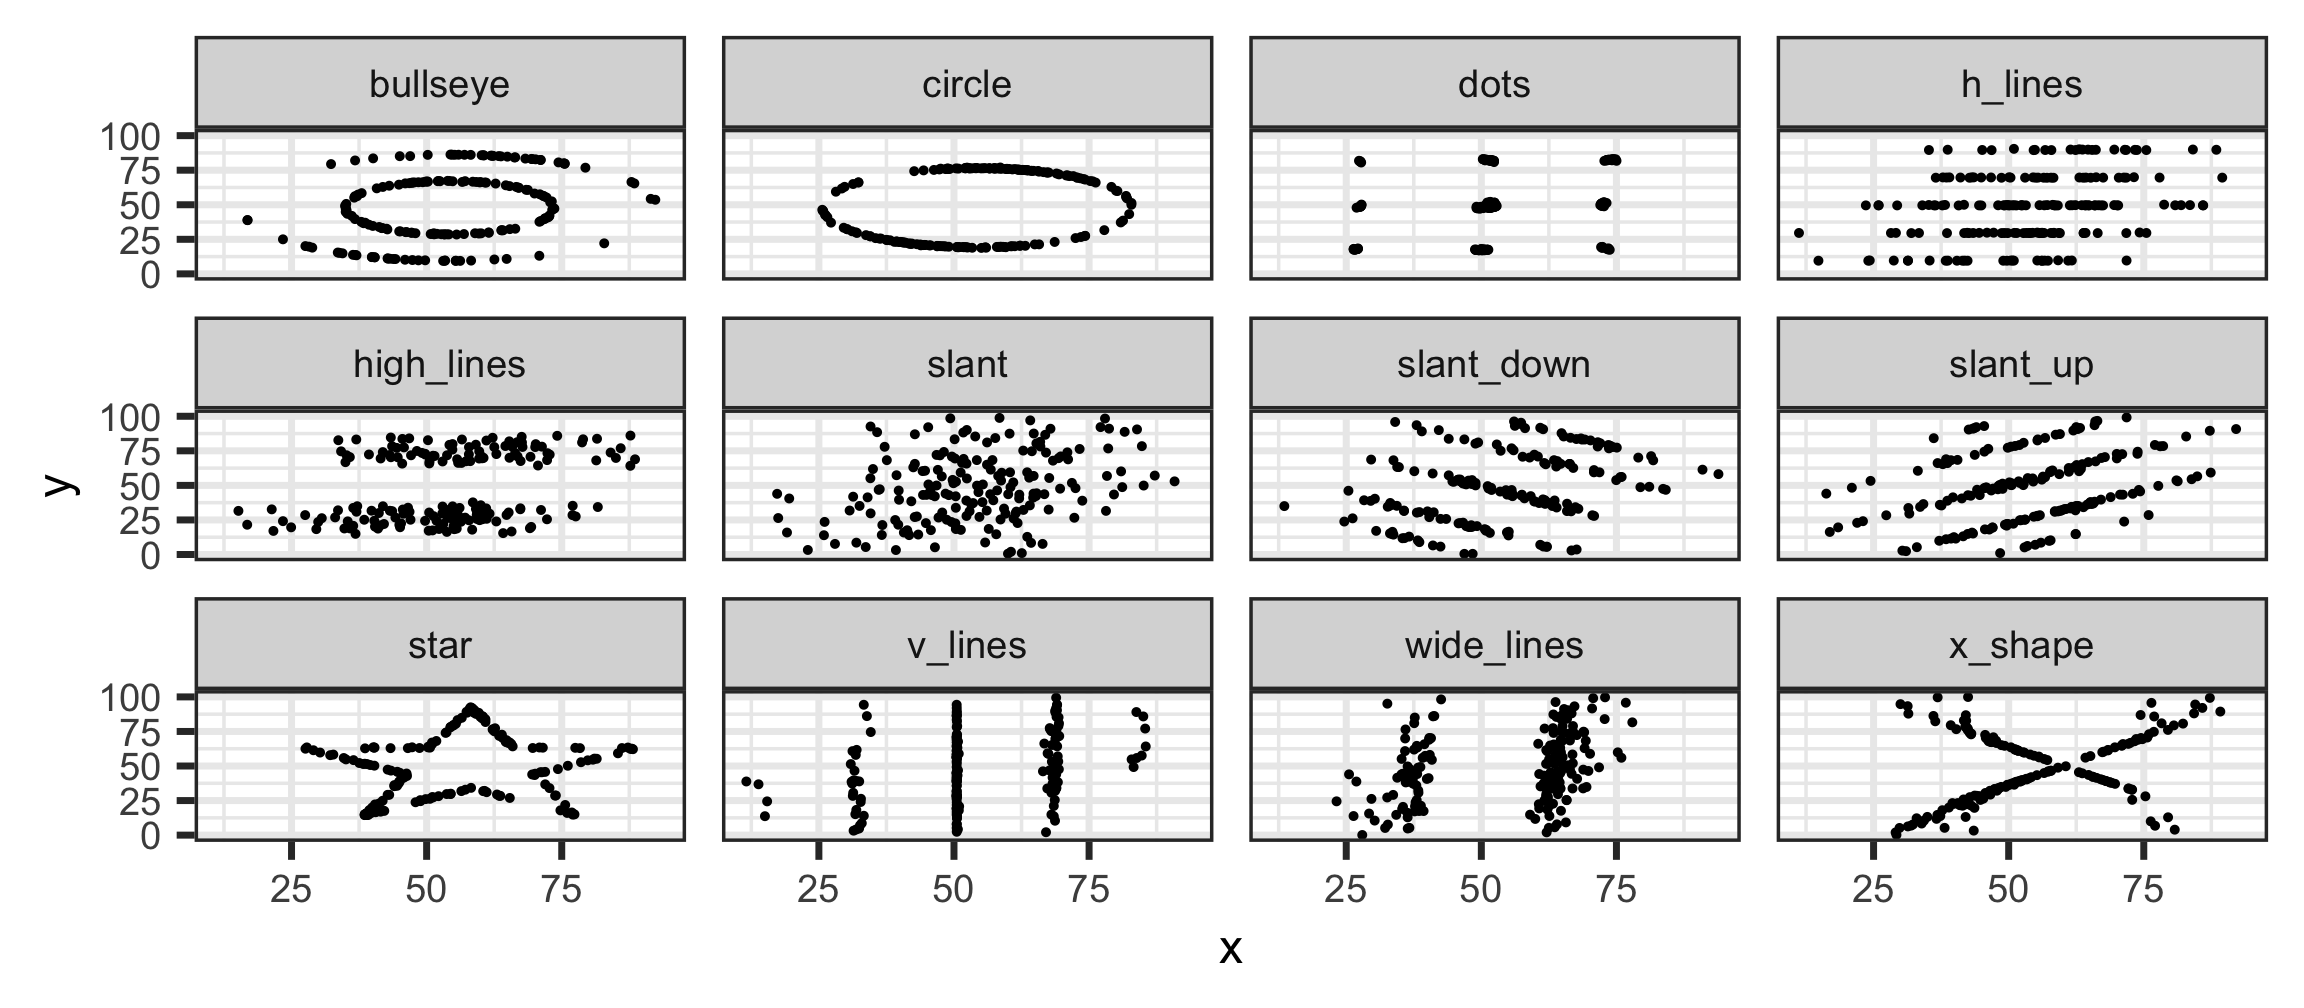
Same Stats, Different Graphs
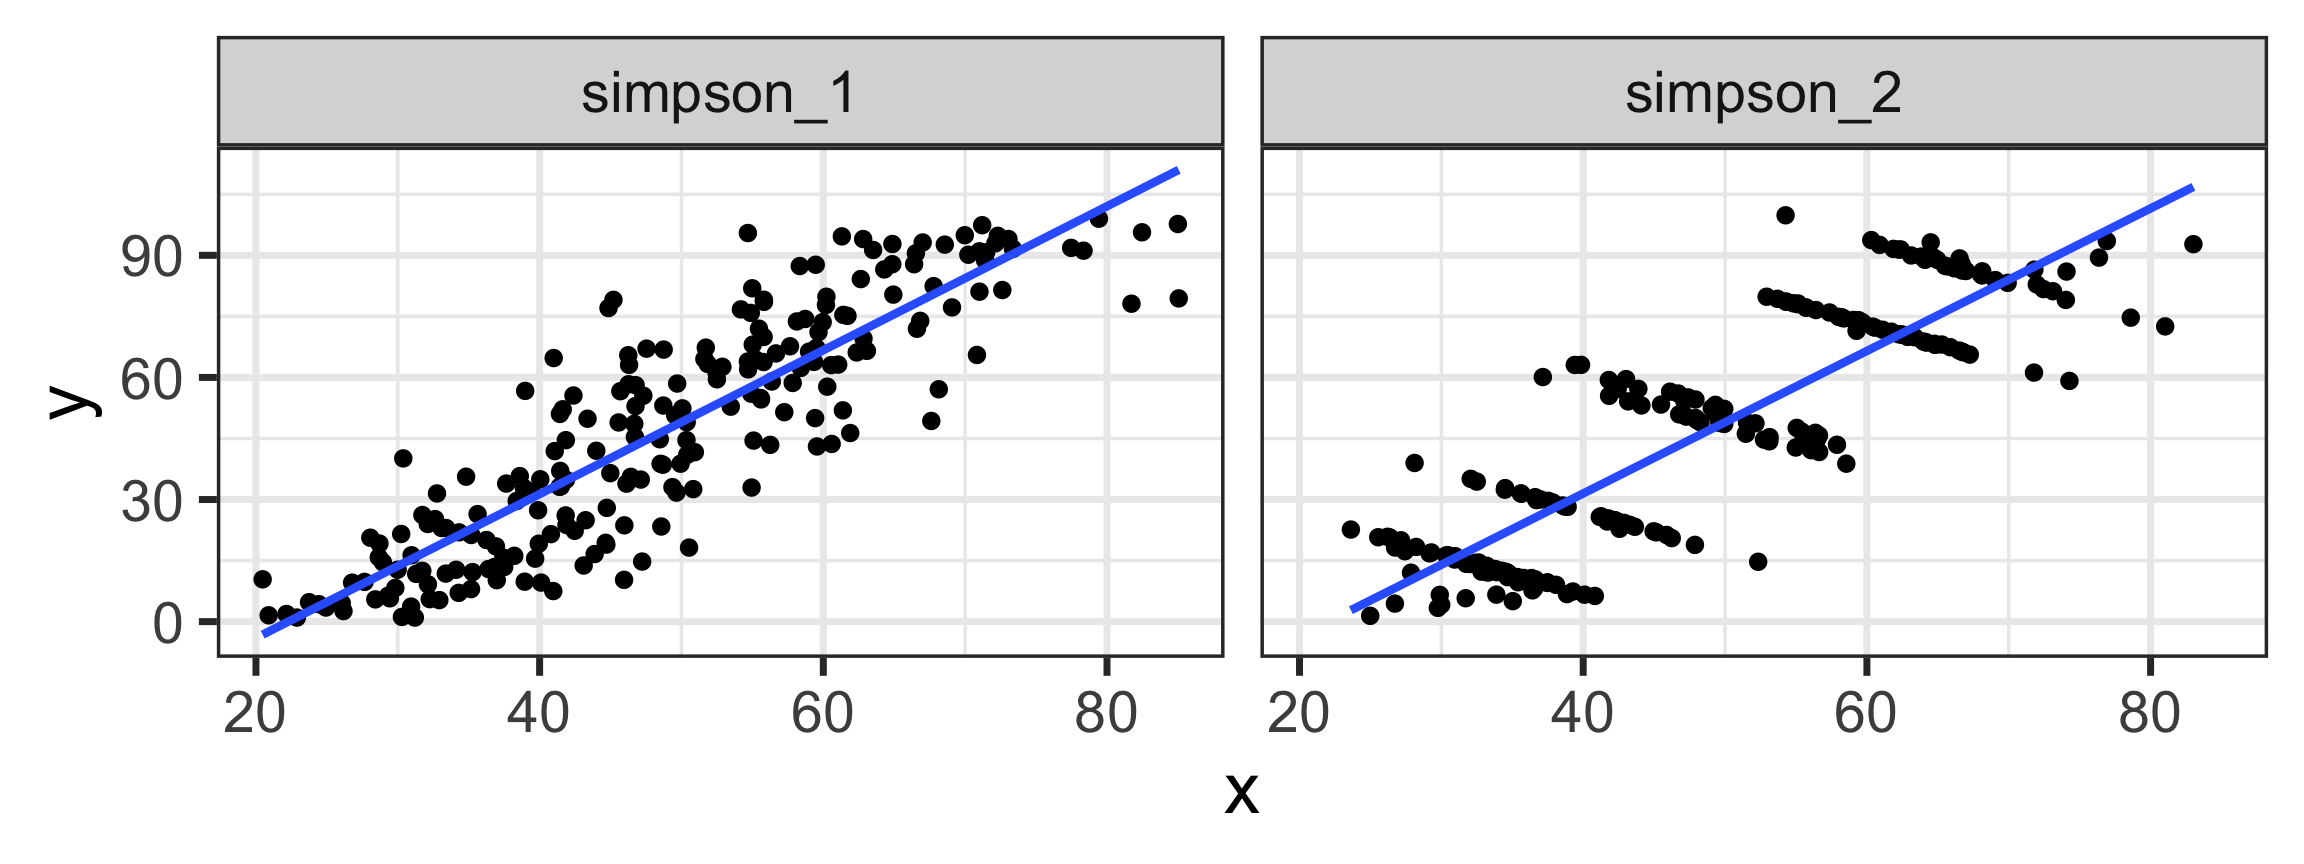
Uncovering Simpson’s paradox
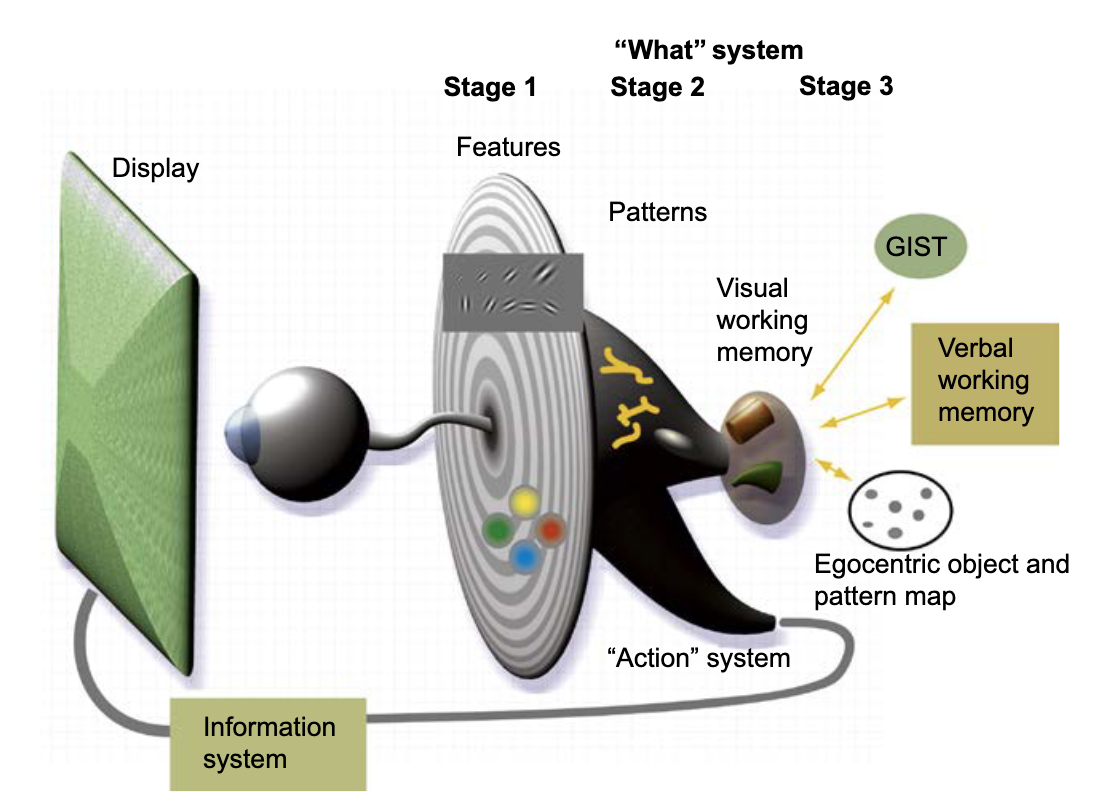
A model of visual information processing
Visual encodings
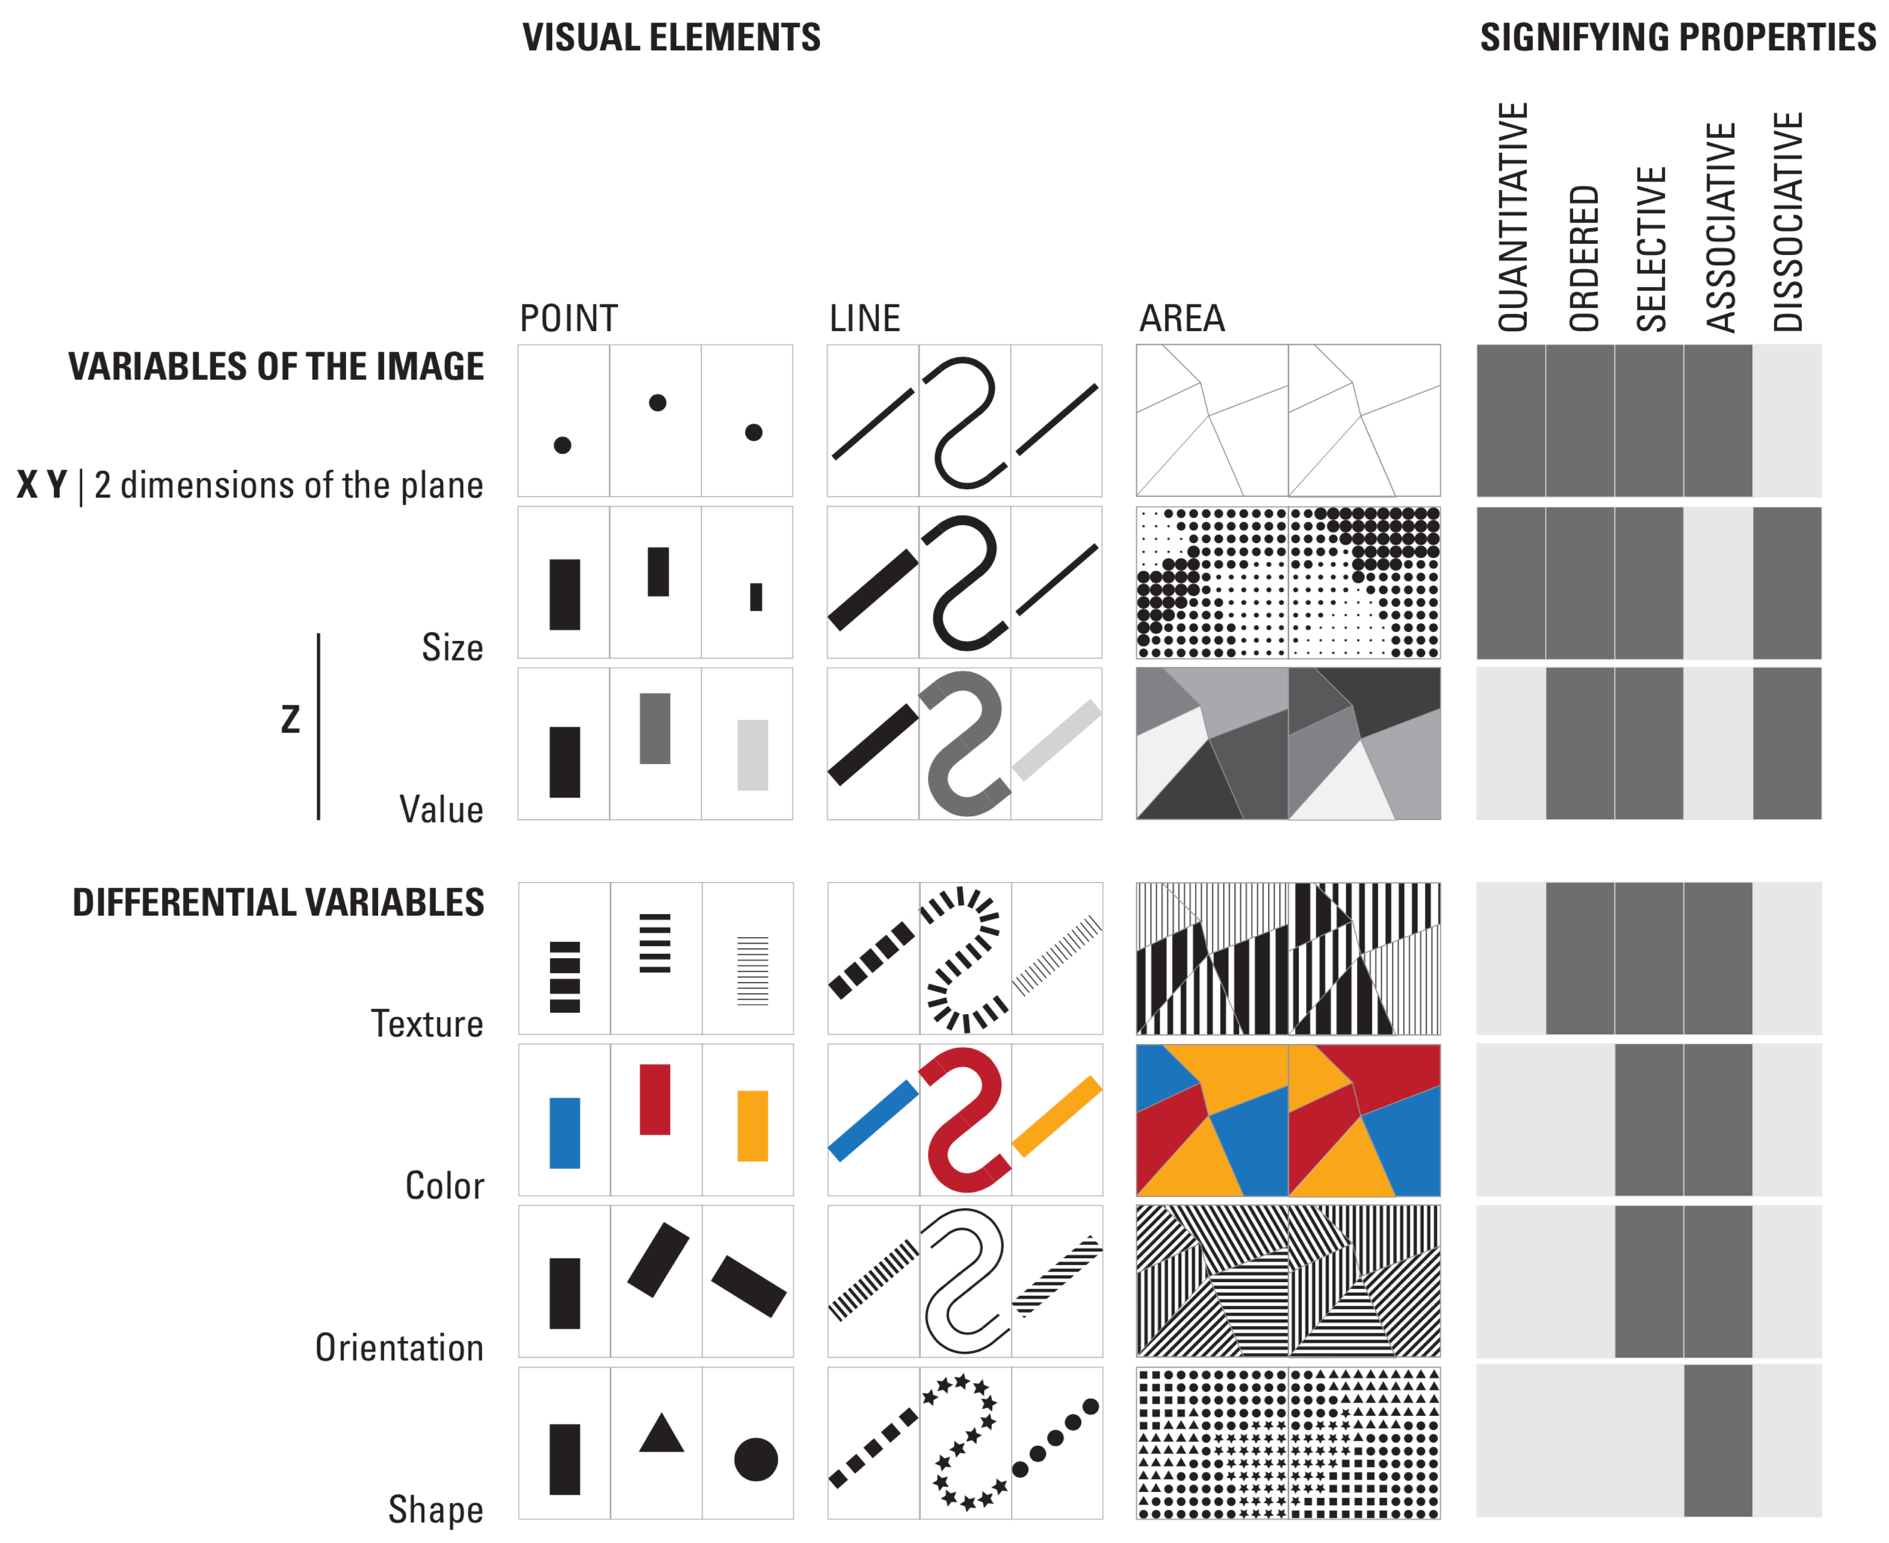
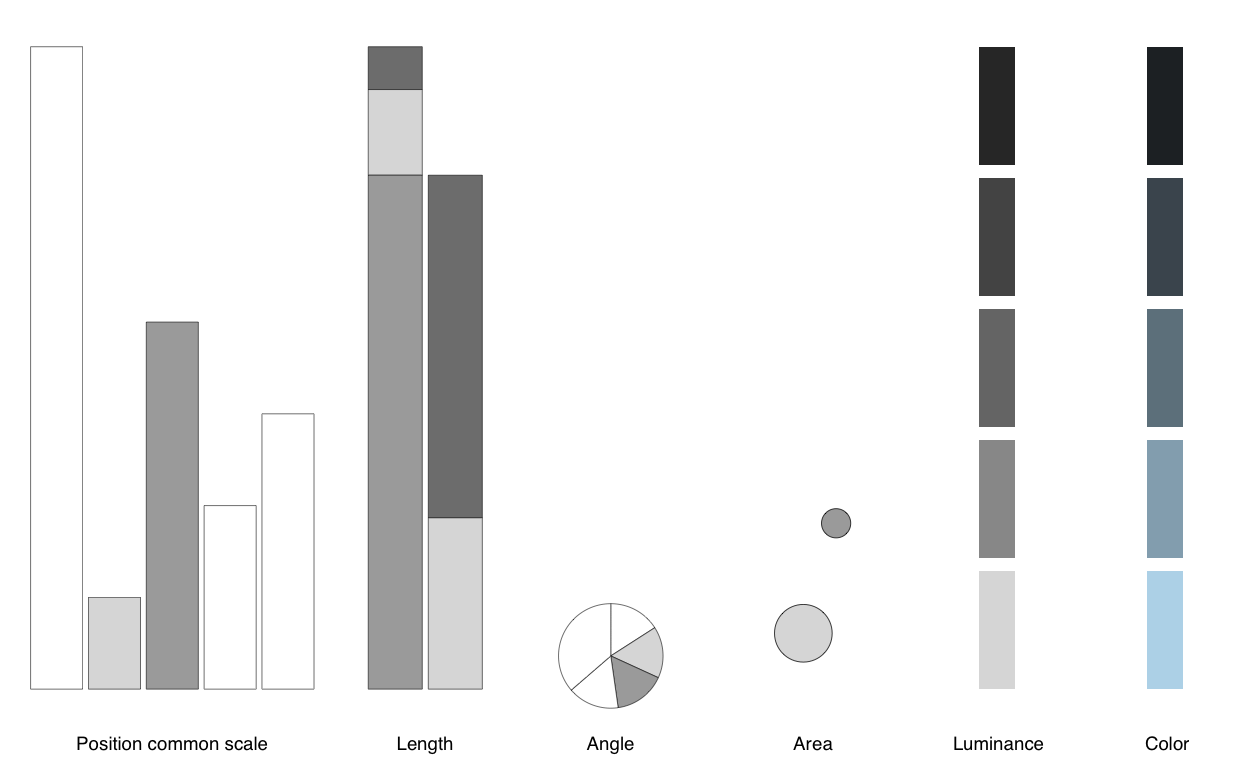
Effectiveness of visual encoding
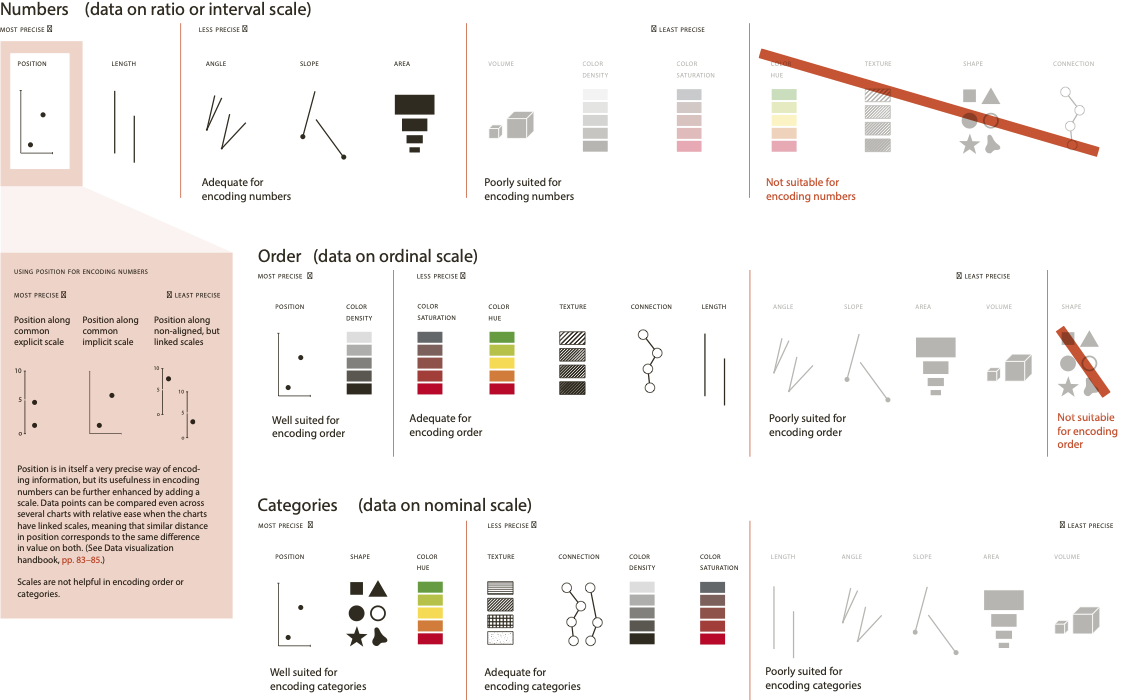
Effectiveness of visual encoding by data type
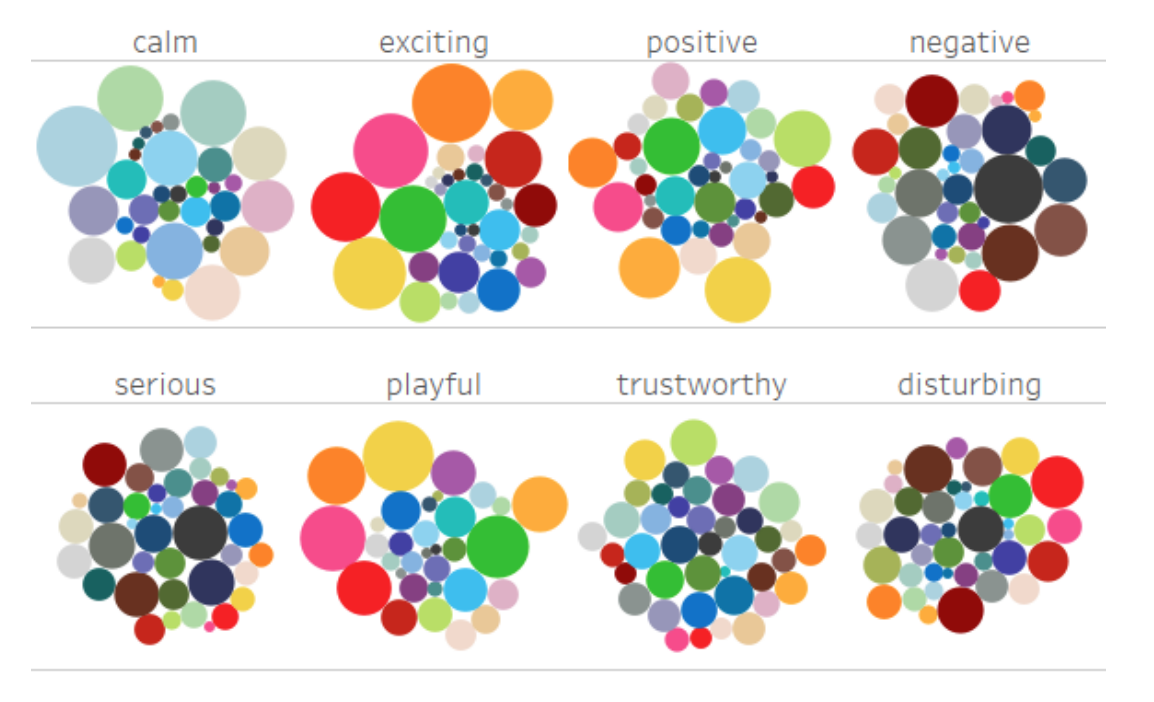
Affectiveness by color
Daily maximum temperature
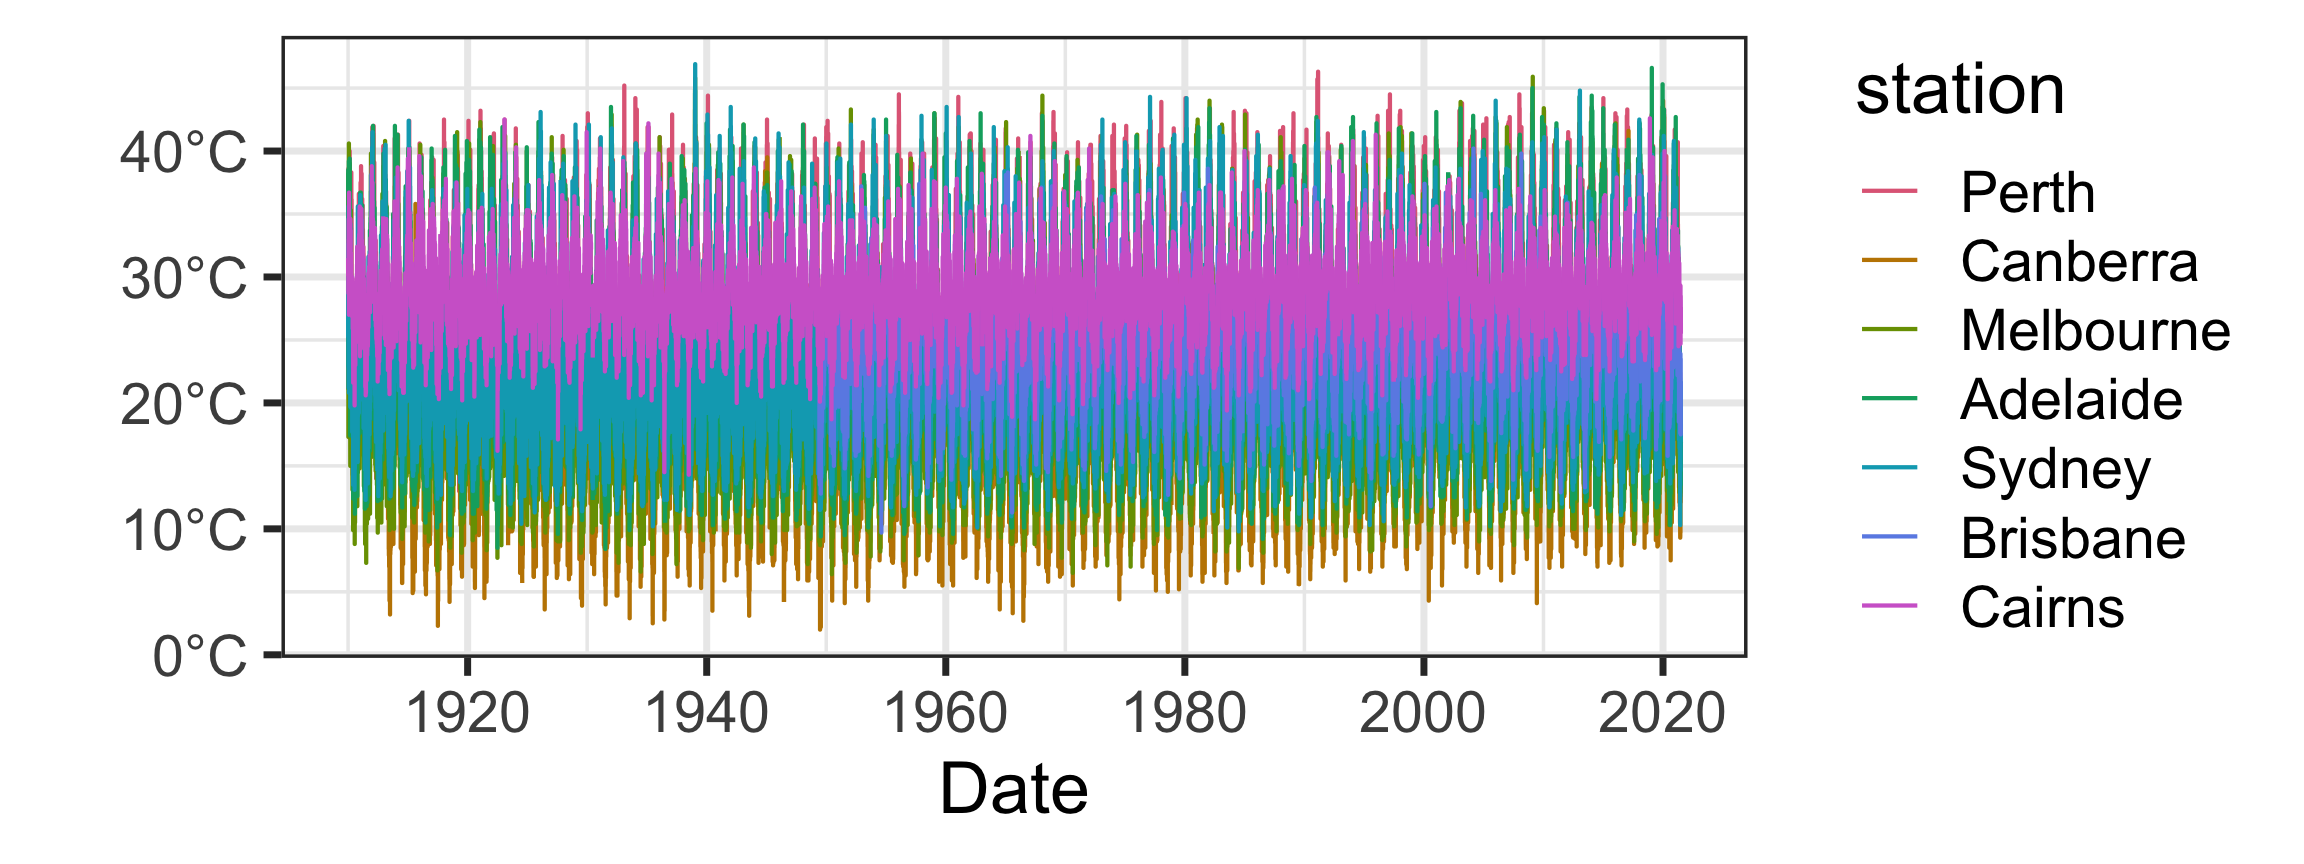
Very long time series… what’s the intended message?
Recent maximum temperature trend
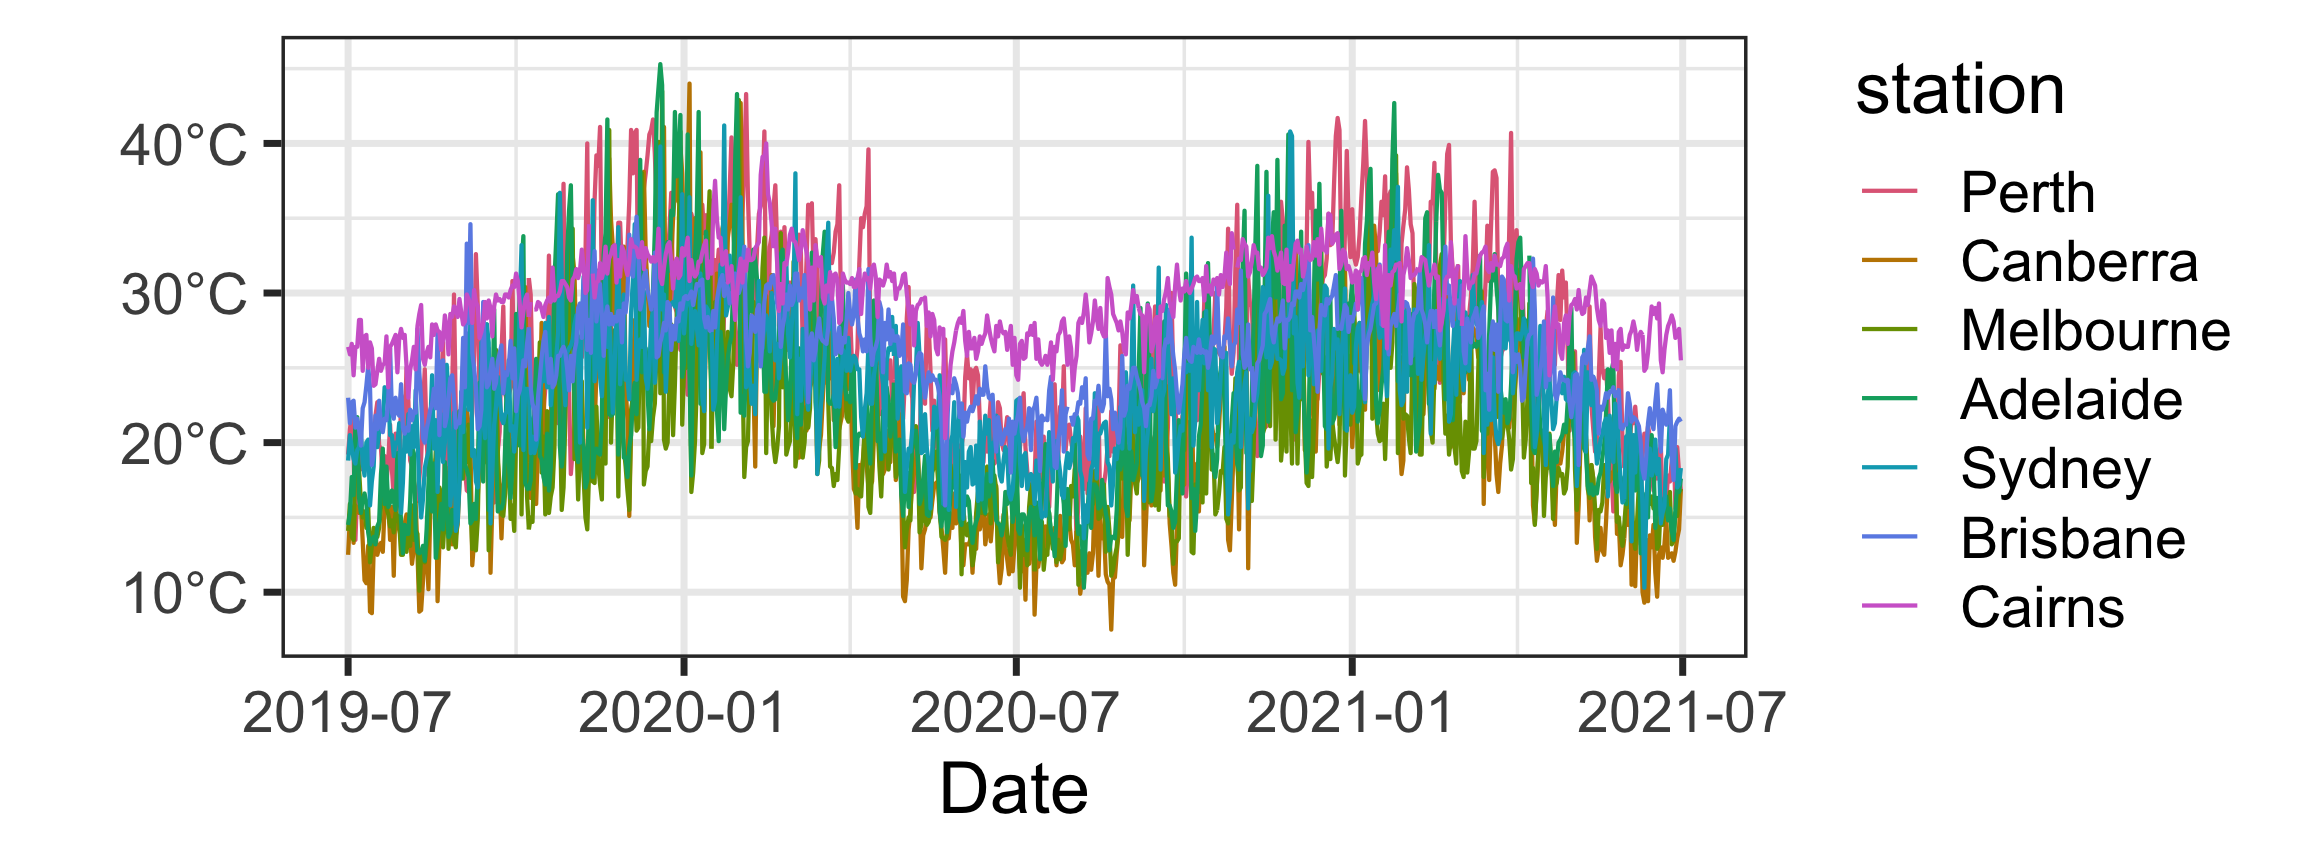
Lots of fluctuation in temperature… does it show the trend?
Recent maximum temperature trend
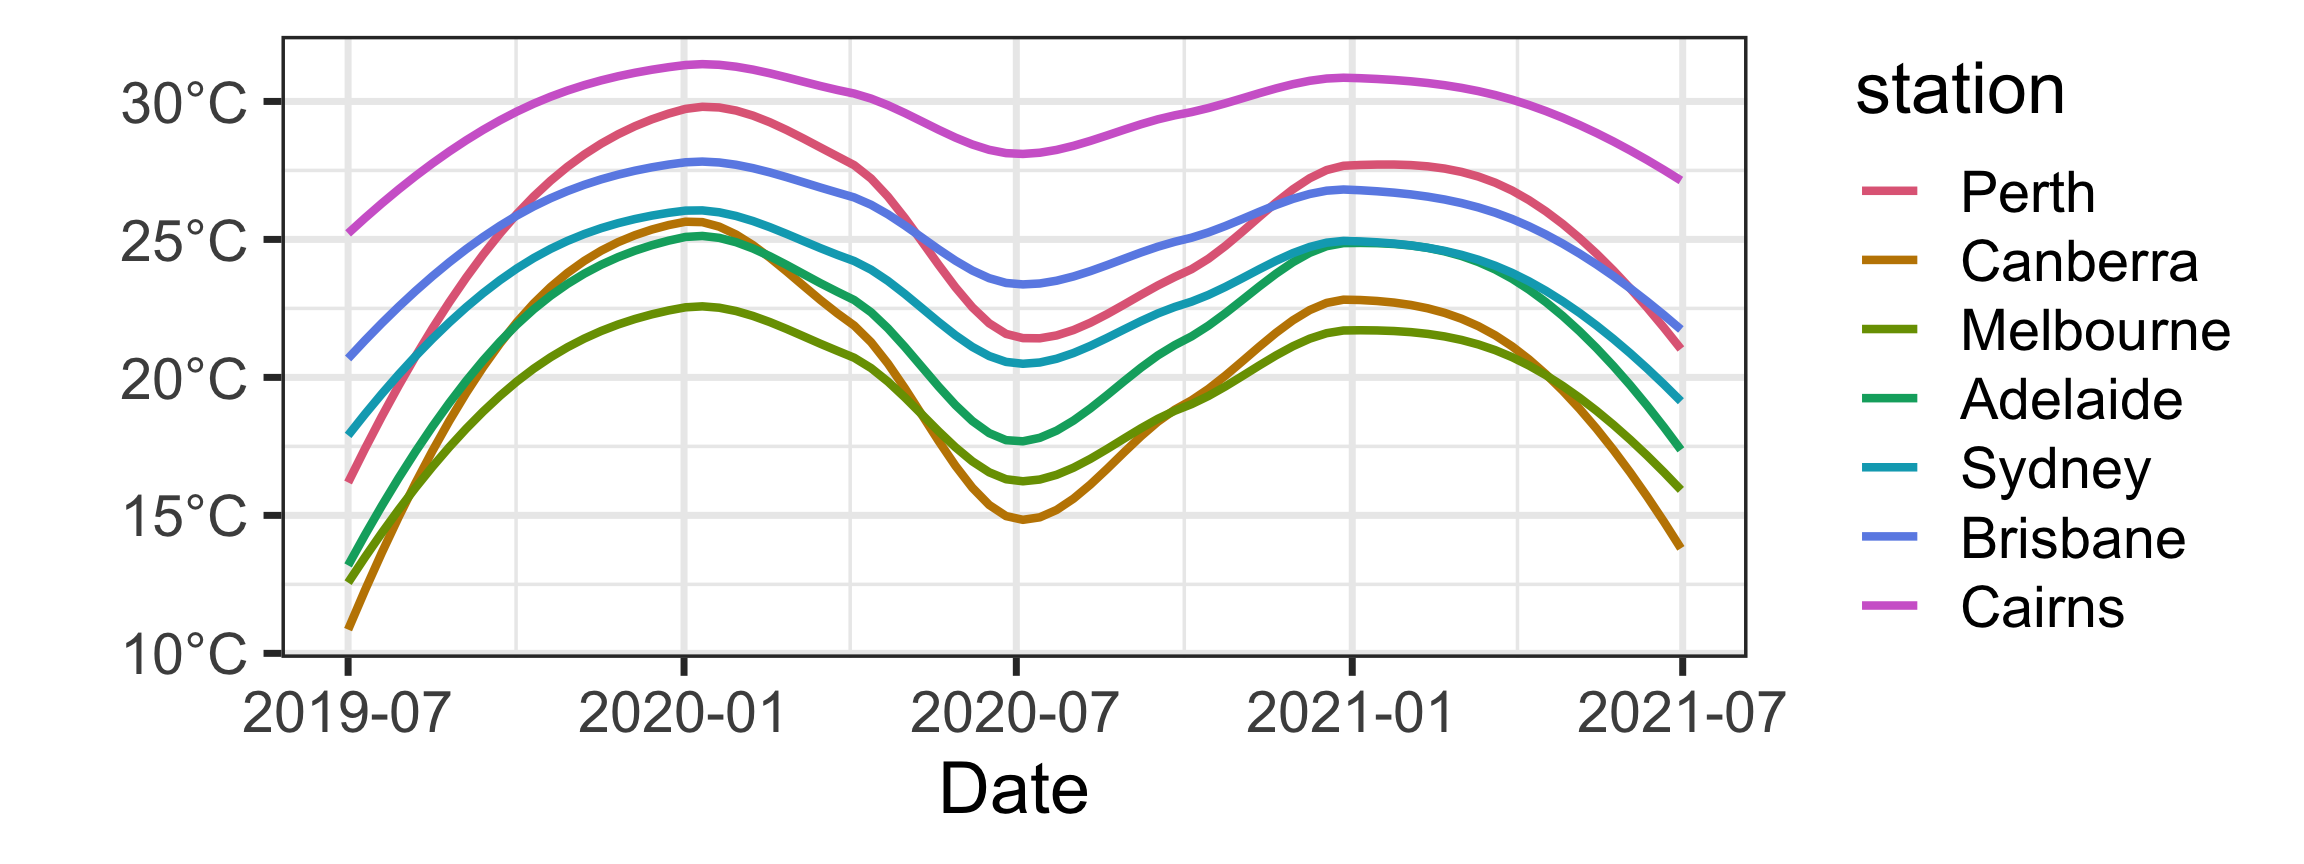
This is showing the fit from a GAM model… but we lost understanding the underlying variation in the original data
Recent maximum temperature trend
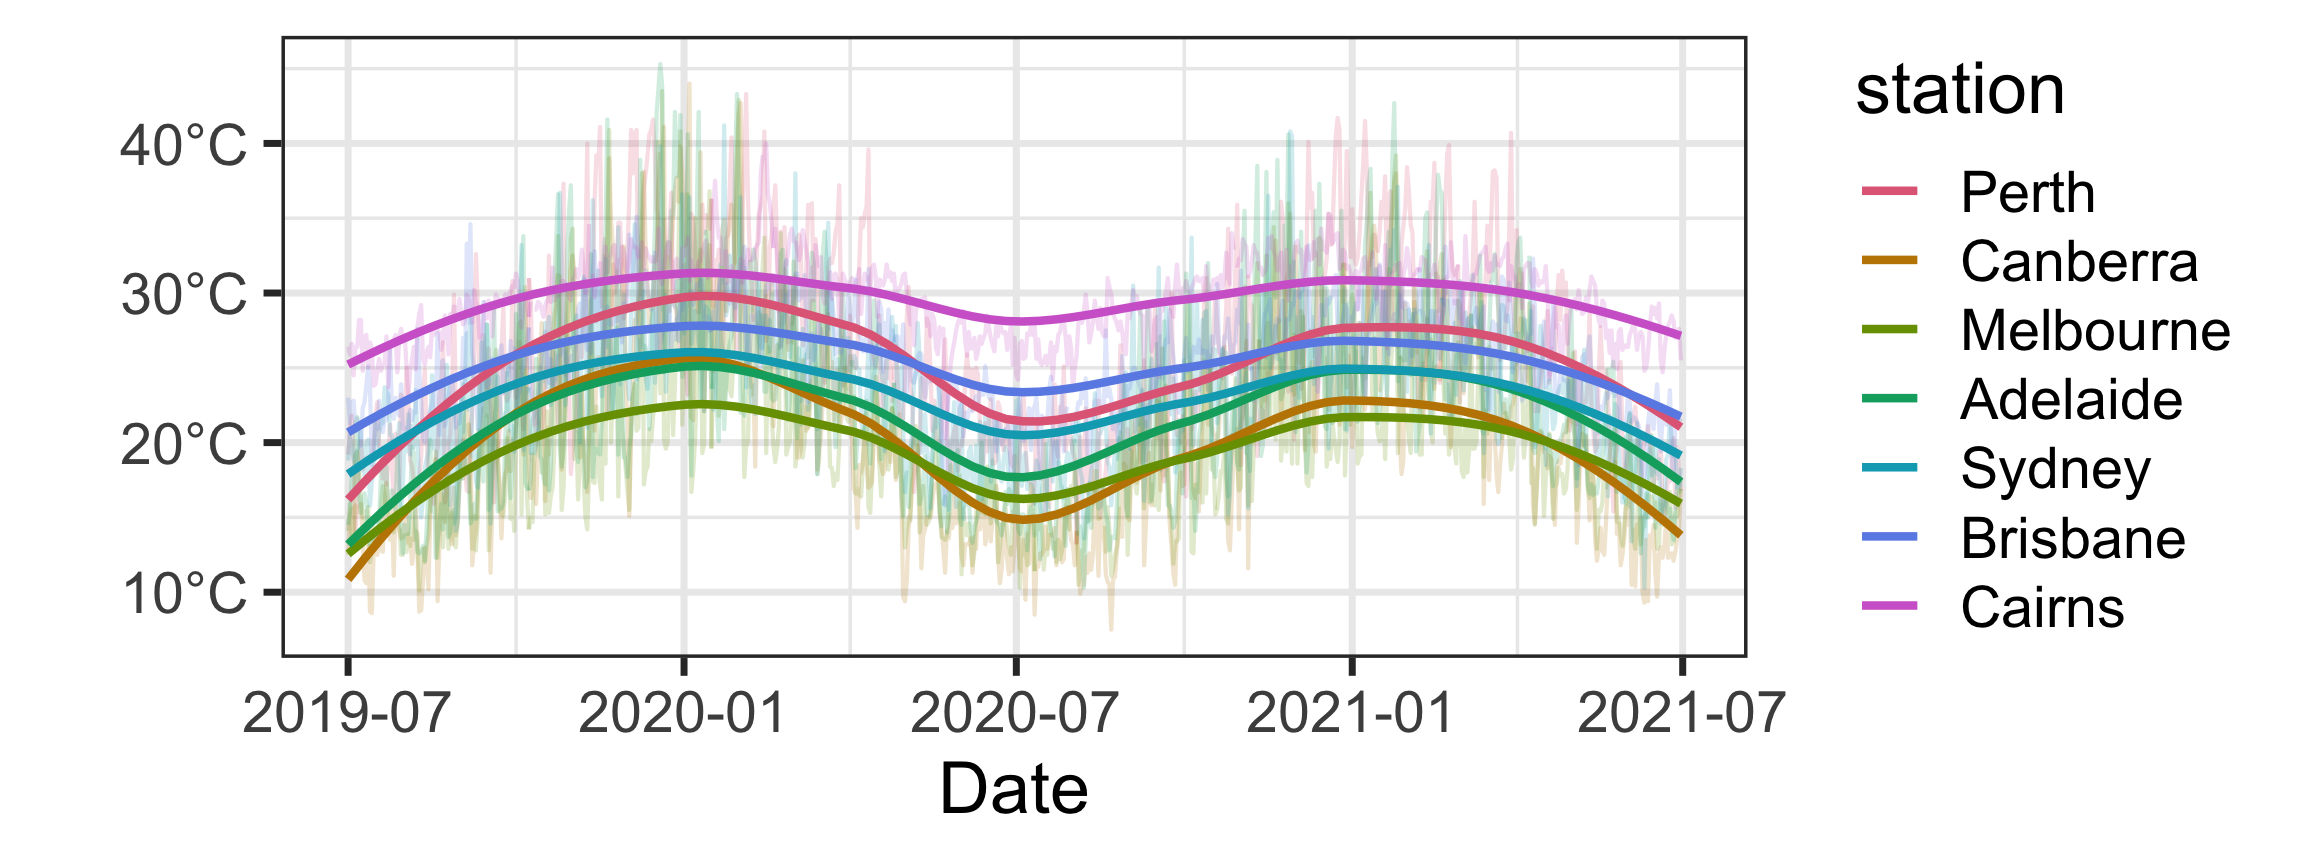
Some models don’t look like a good fit… let’s examine individually
Recent maximum temperature trend
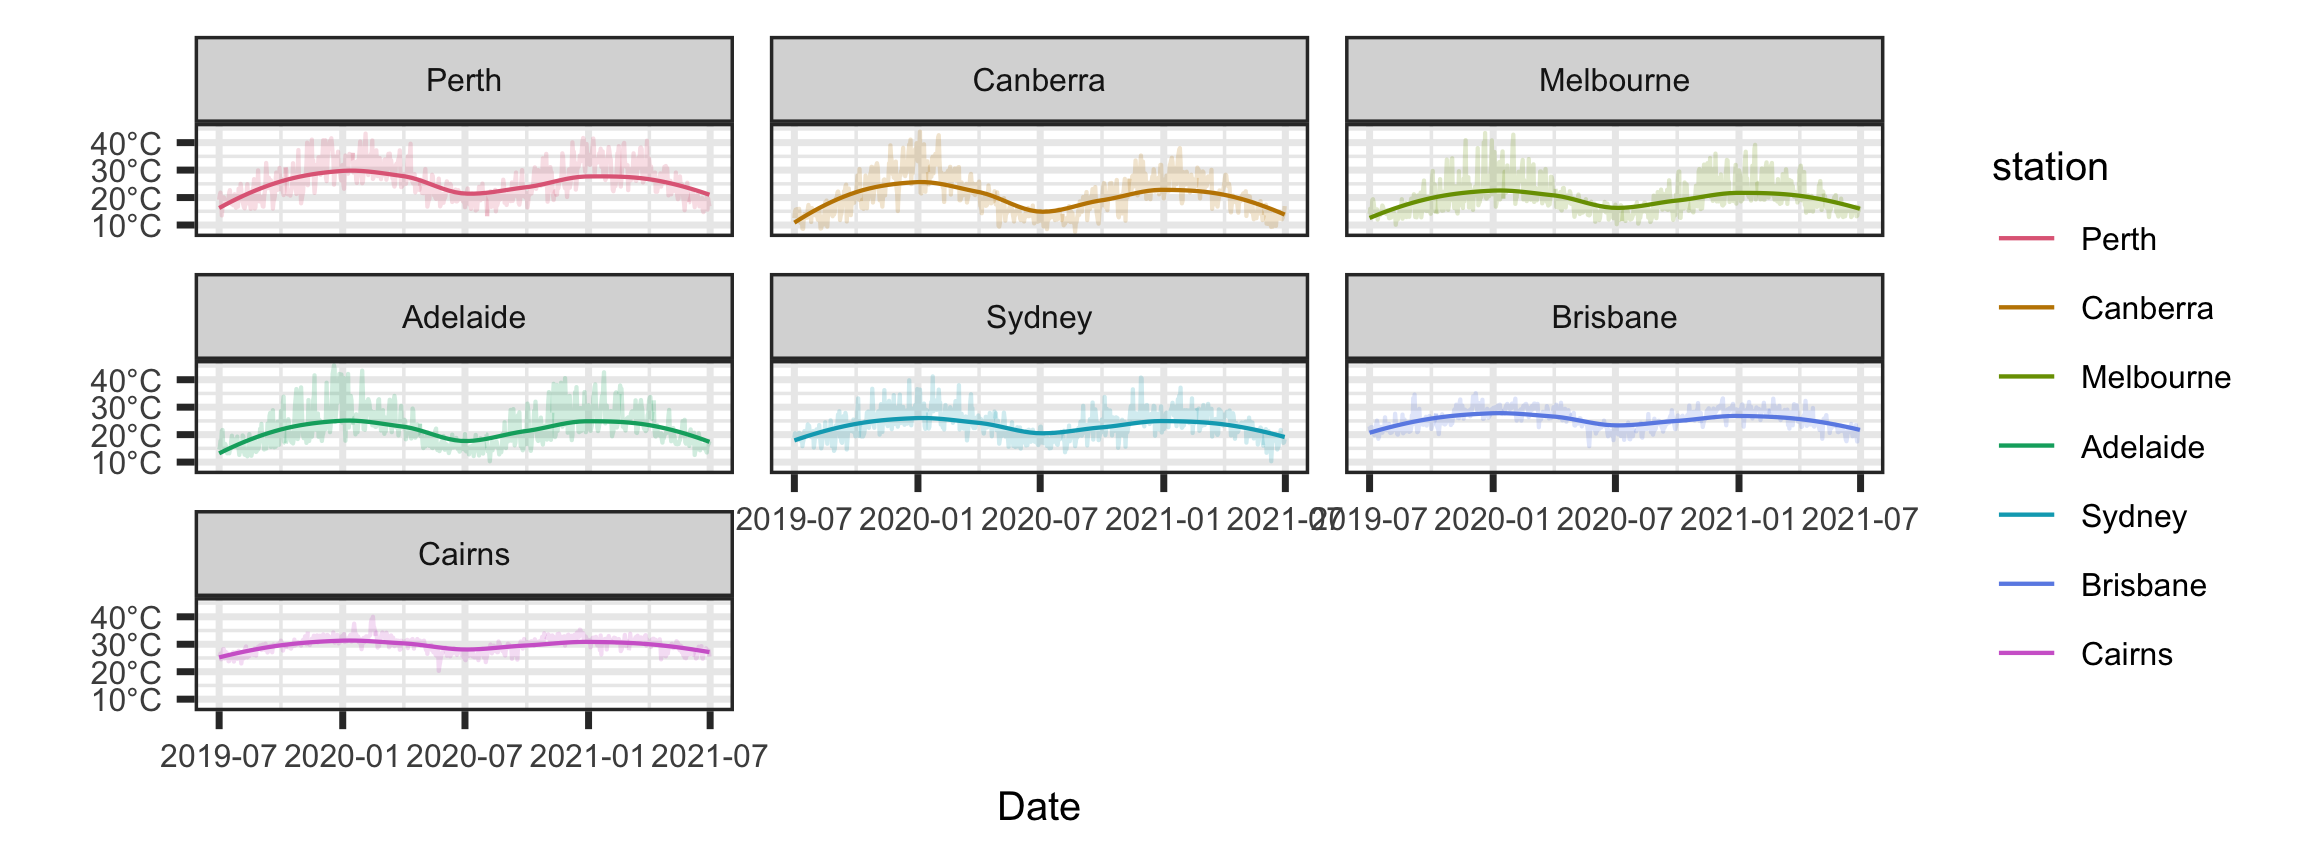
The legend is redundant here… remove unnessary elements.
Recent maximum temperature trend
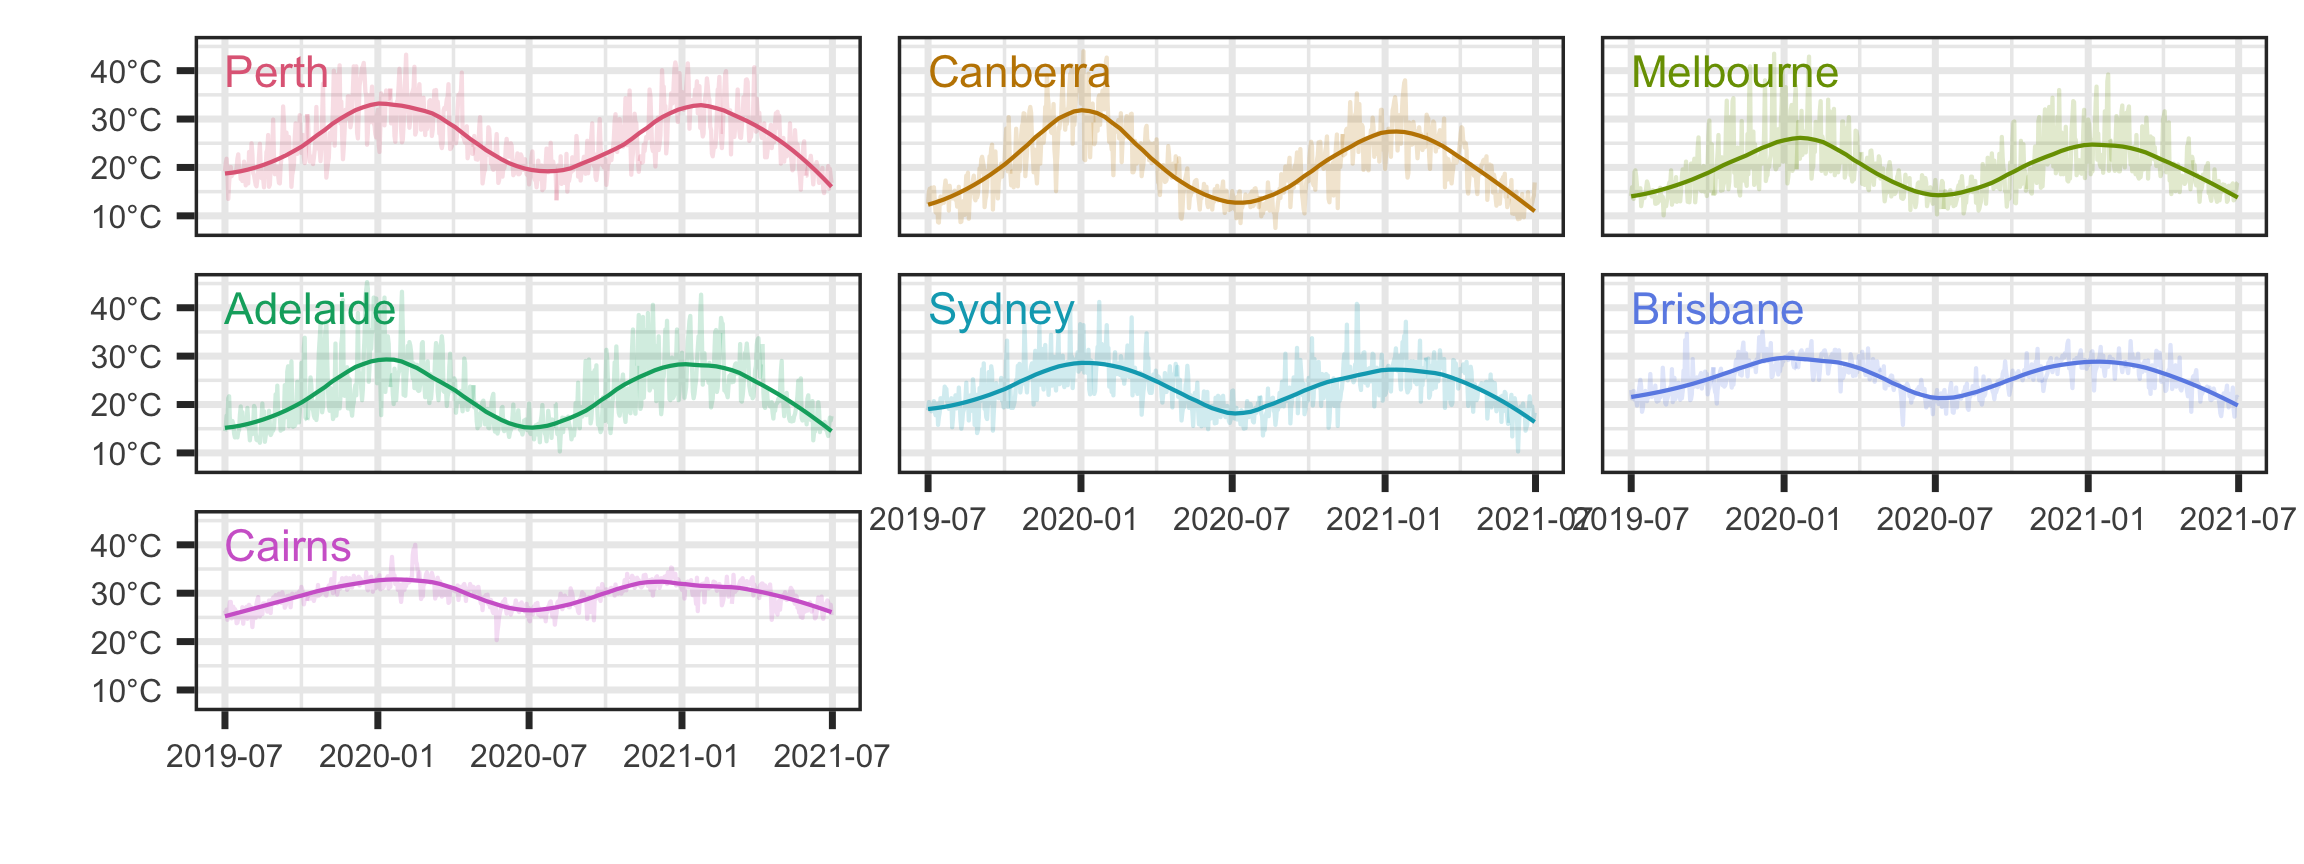
Using loess with span of 0.3 instead … comparison across location is harder when in data shown in different panels
Recent maximum temperature trend
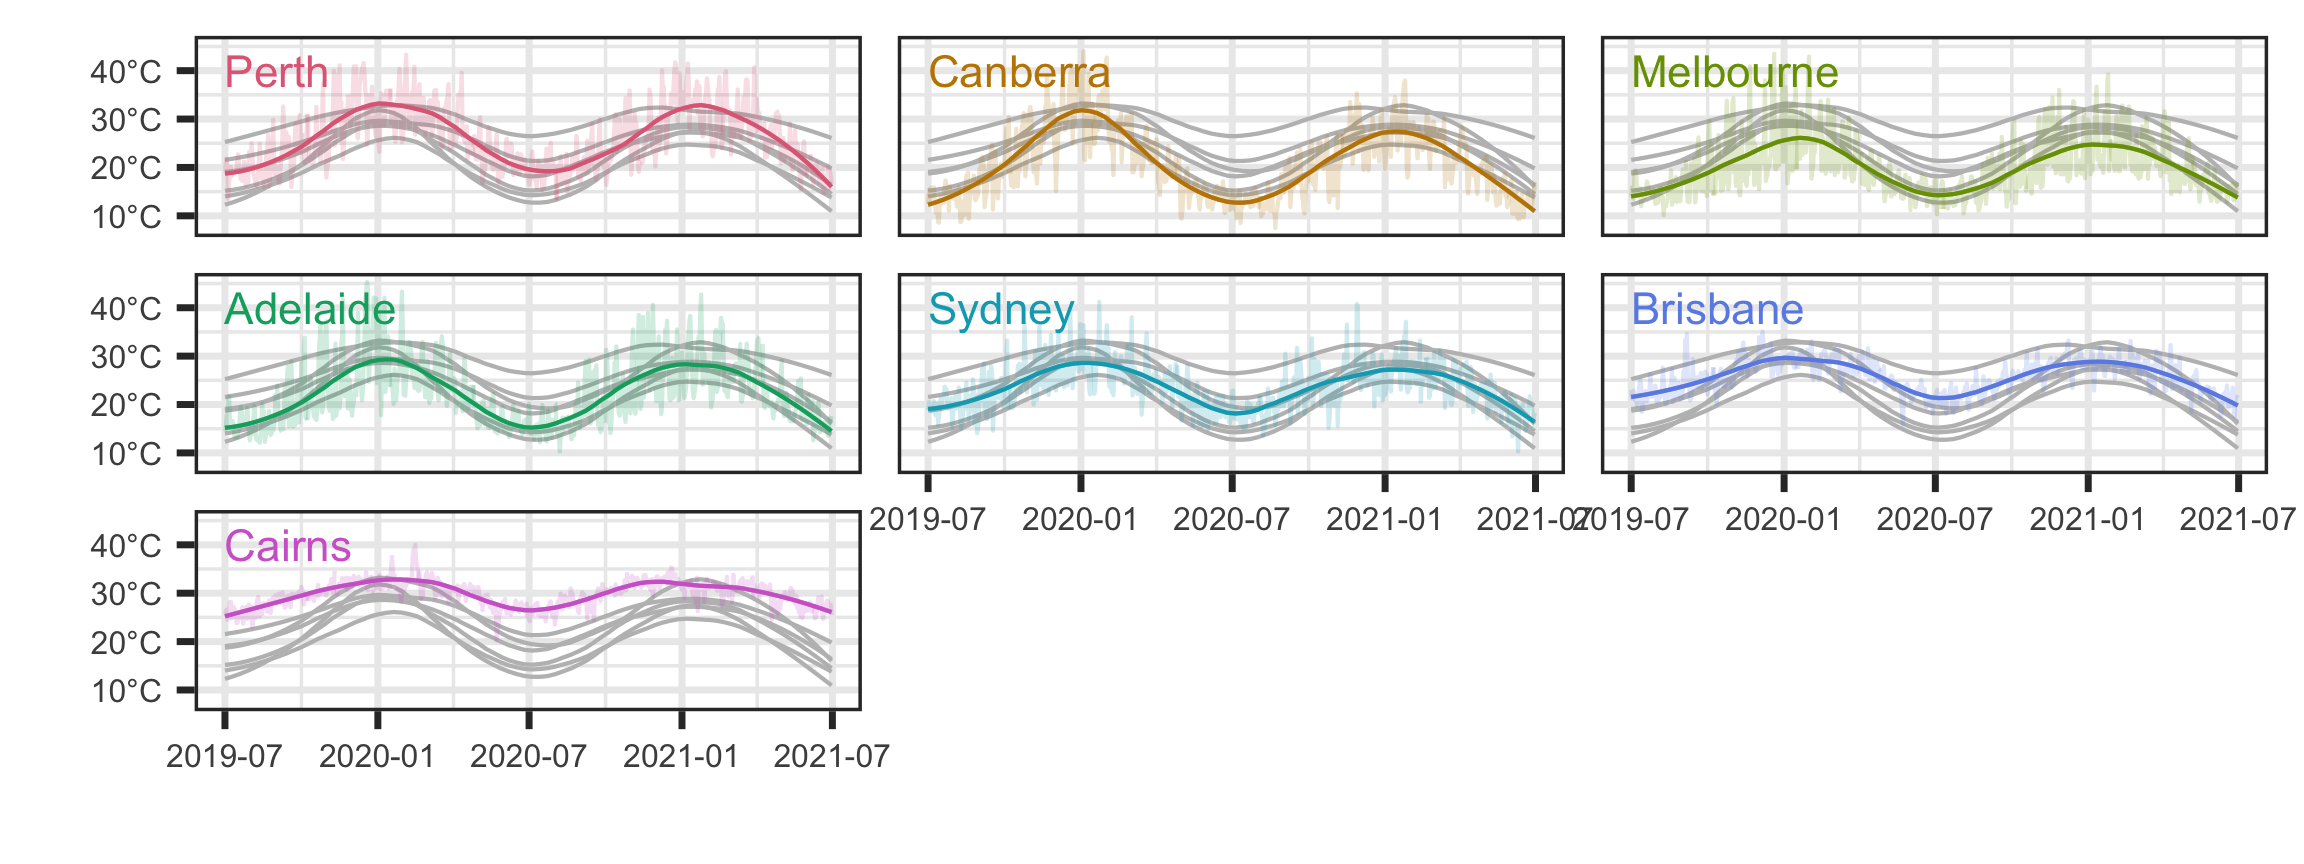
Casting a shadow of the trend across locations in each panel makes it easier to compare the trend…
Recent maximum temperature trend

There were missing values in data that wasn’t apparent before!
Weekly average maximum temperature trend
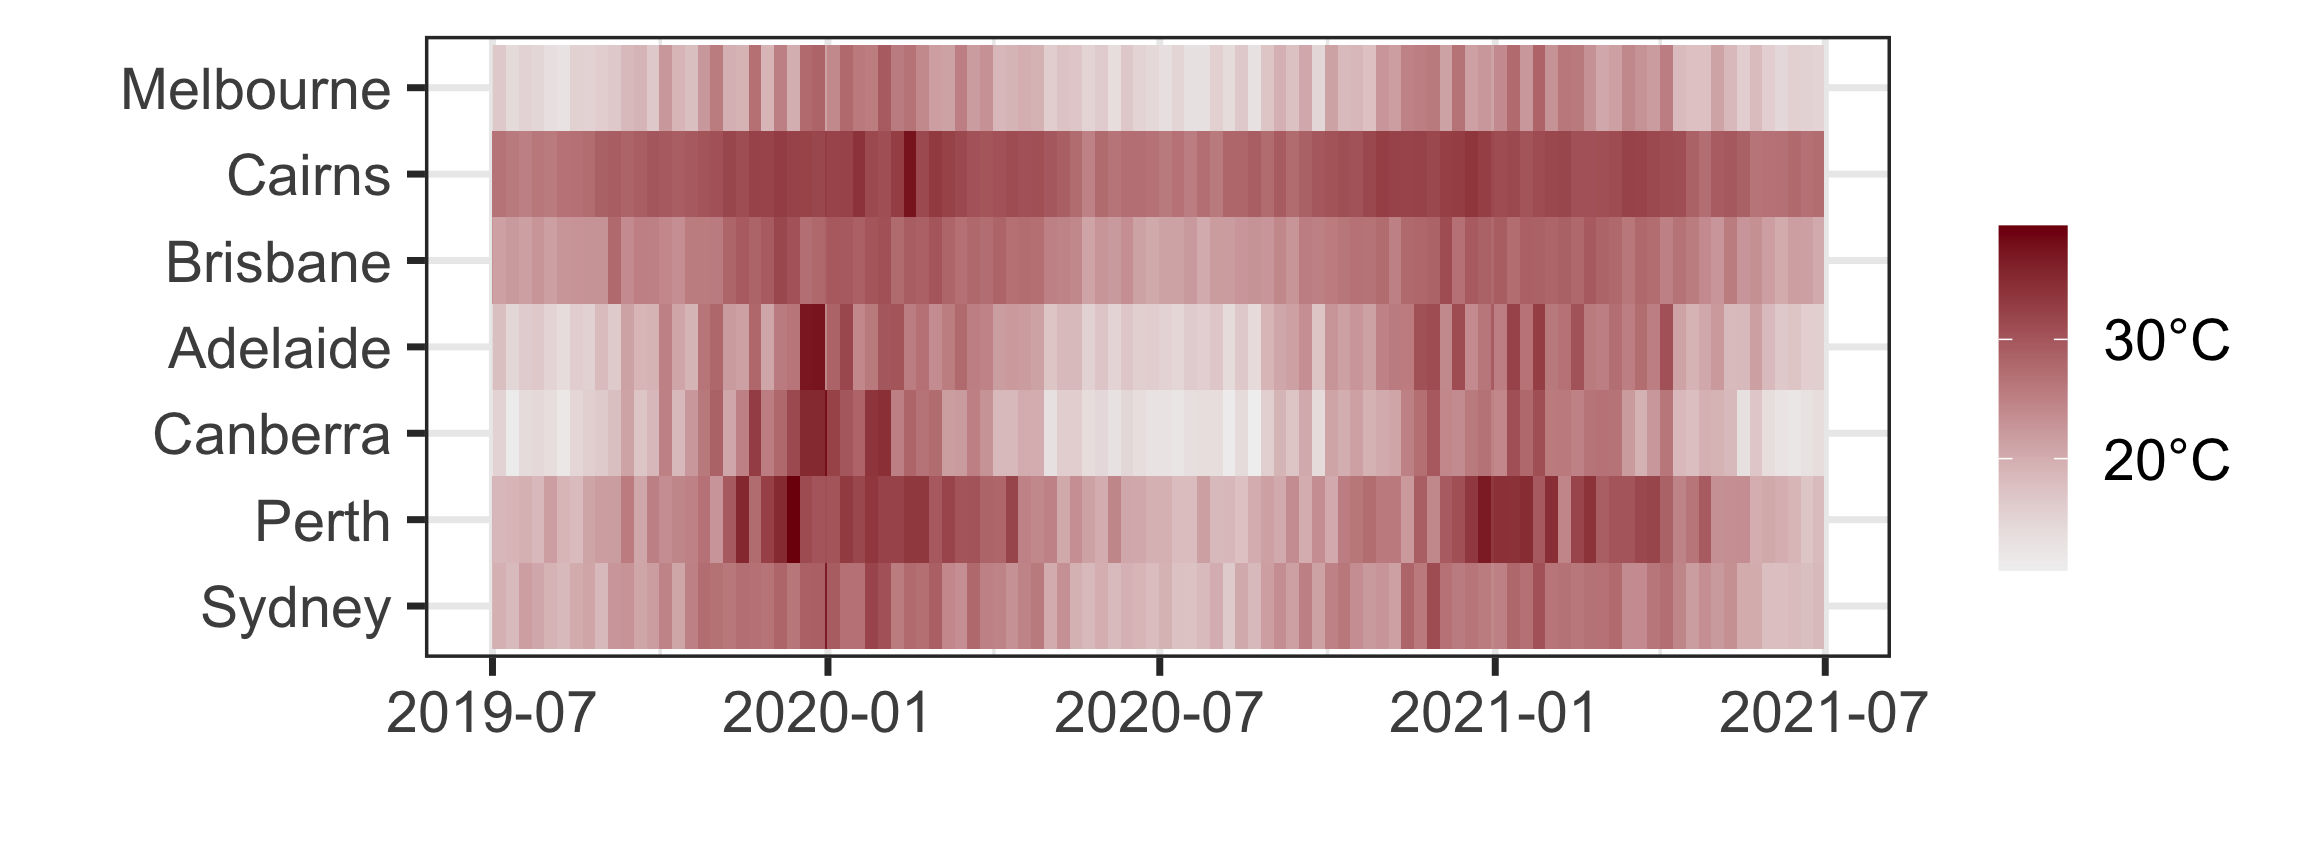
By taking weekly averages, the plot is smoother and you can focus on the main trend instead instead of getting distracted with daily fluctuations.
Maximum temperature trend by month
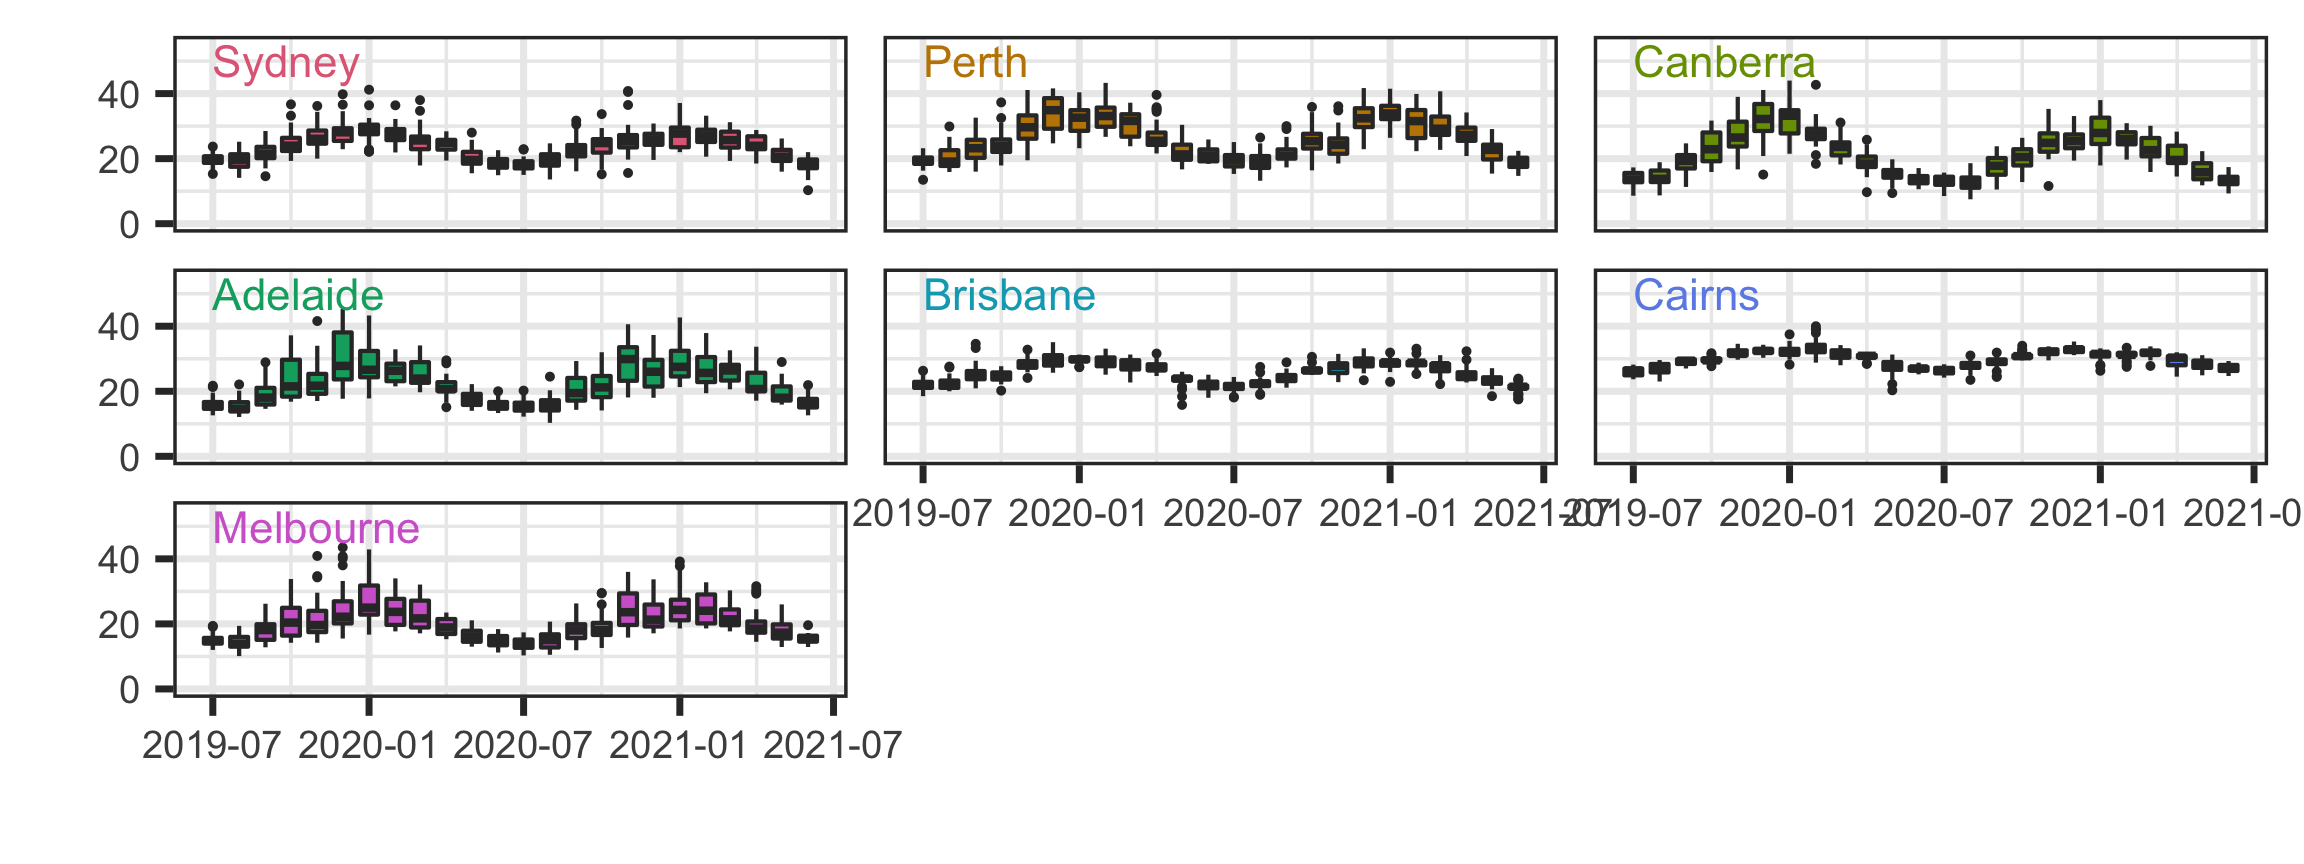
This plot is easier to see the overall trend and the monthly variation…
Can you think of other way to visualise the trend?
Week 11 Lesson
Summary
- We revised the princples and practices of data visualisation
- We looked at different encoding choices based on the daily maximum temperature
Resources
- Spencer (2022, Feb. 17). Data in Wonderland. Section 2.
- Ware, Colin (2021) Information Visualisation: Perception for Design. 4th ed.