Recall: Communication is a process
Transactional communication model
Recall: Communicating with Data
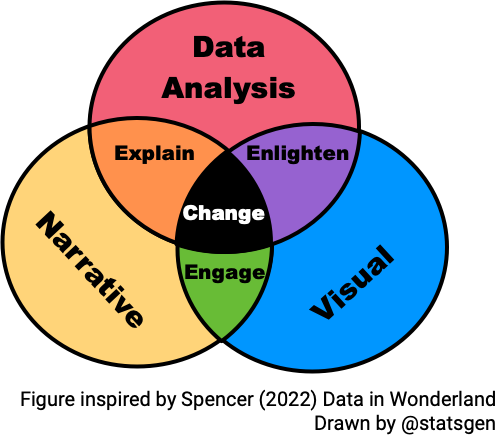
Recall: Rhetorics
- The art of effective or persuasive speaking or writing
Rhetorical triangle

Rhetorical situation
- Writer or Speaker
- Purpose
- Message
- Audience
- Context
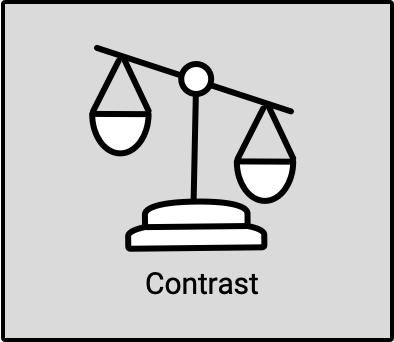
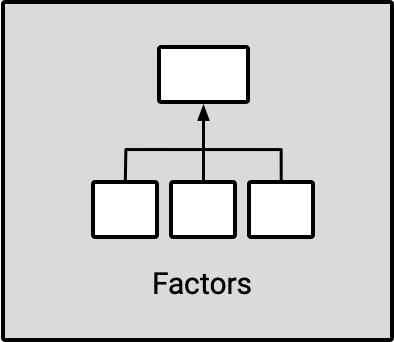
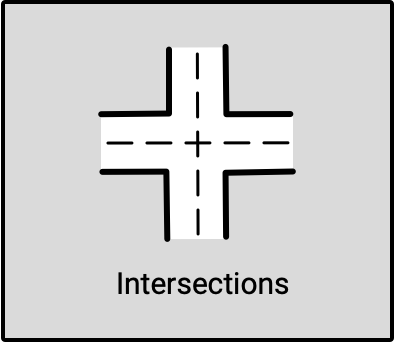
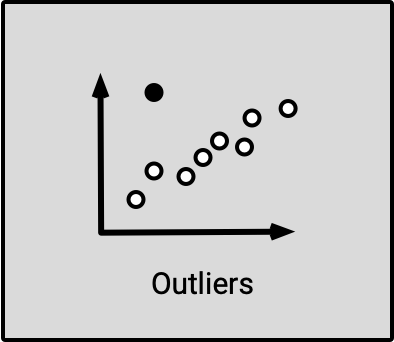
Data Story Types
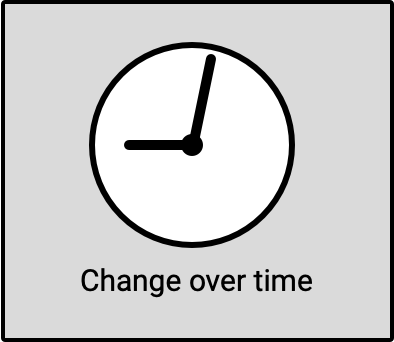
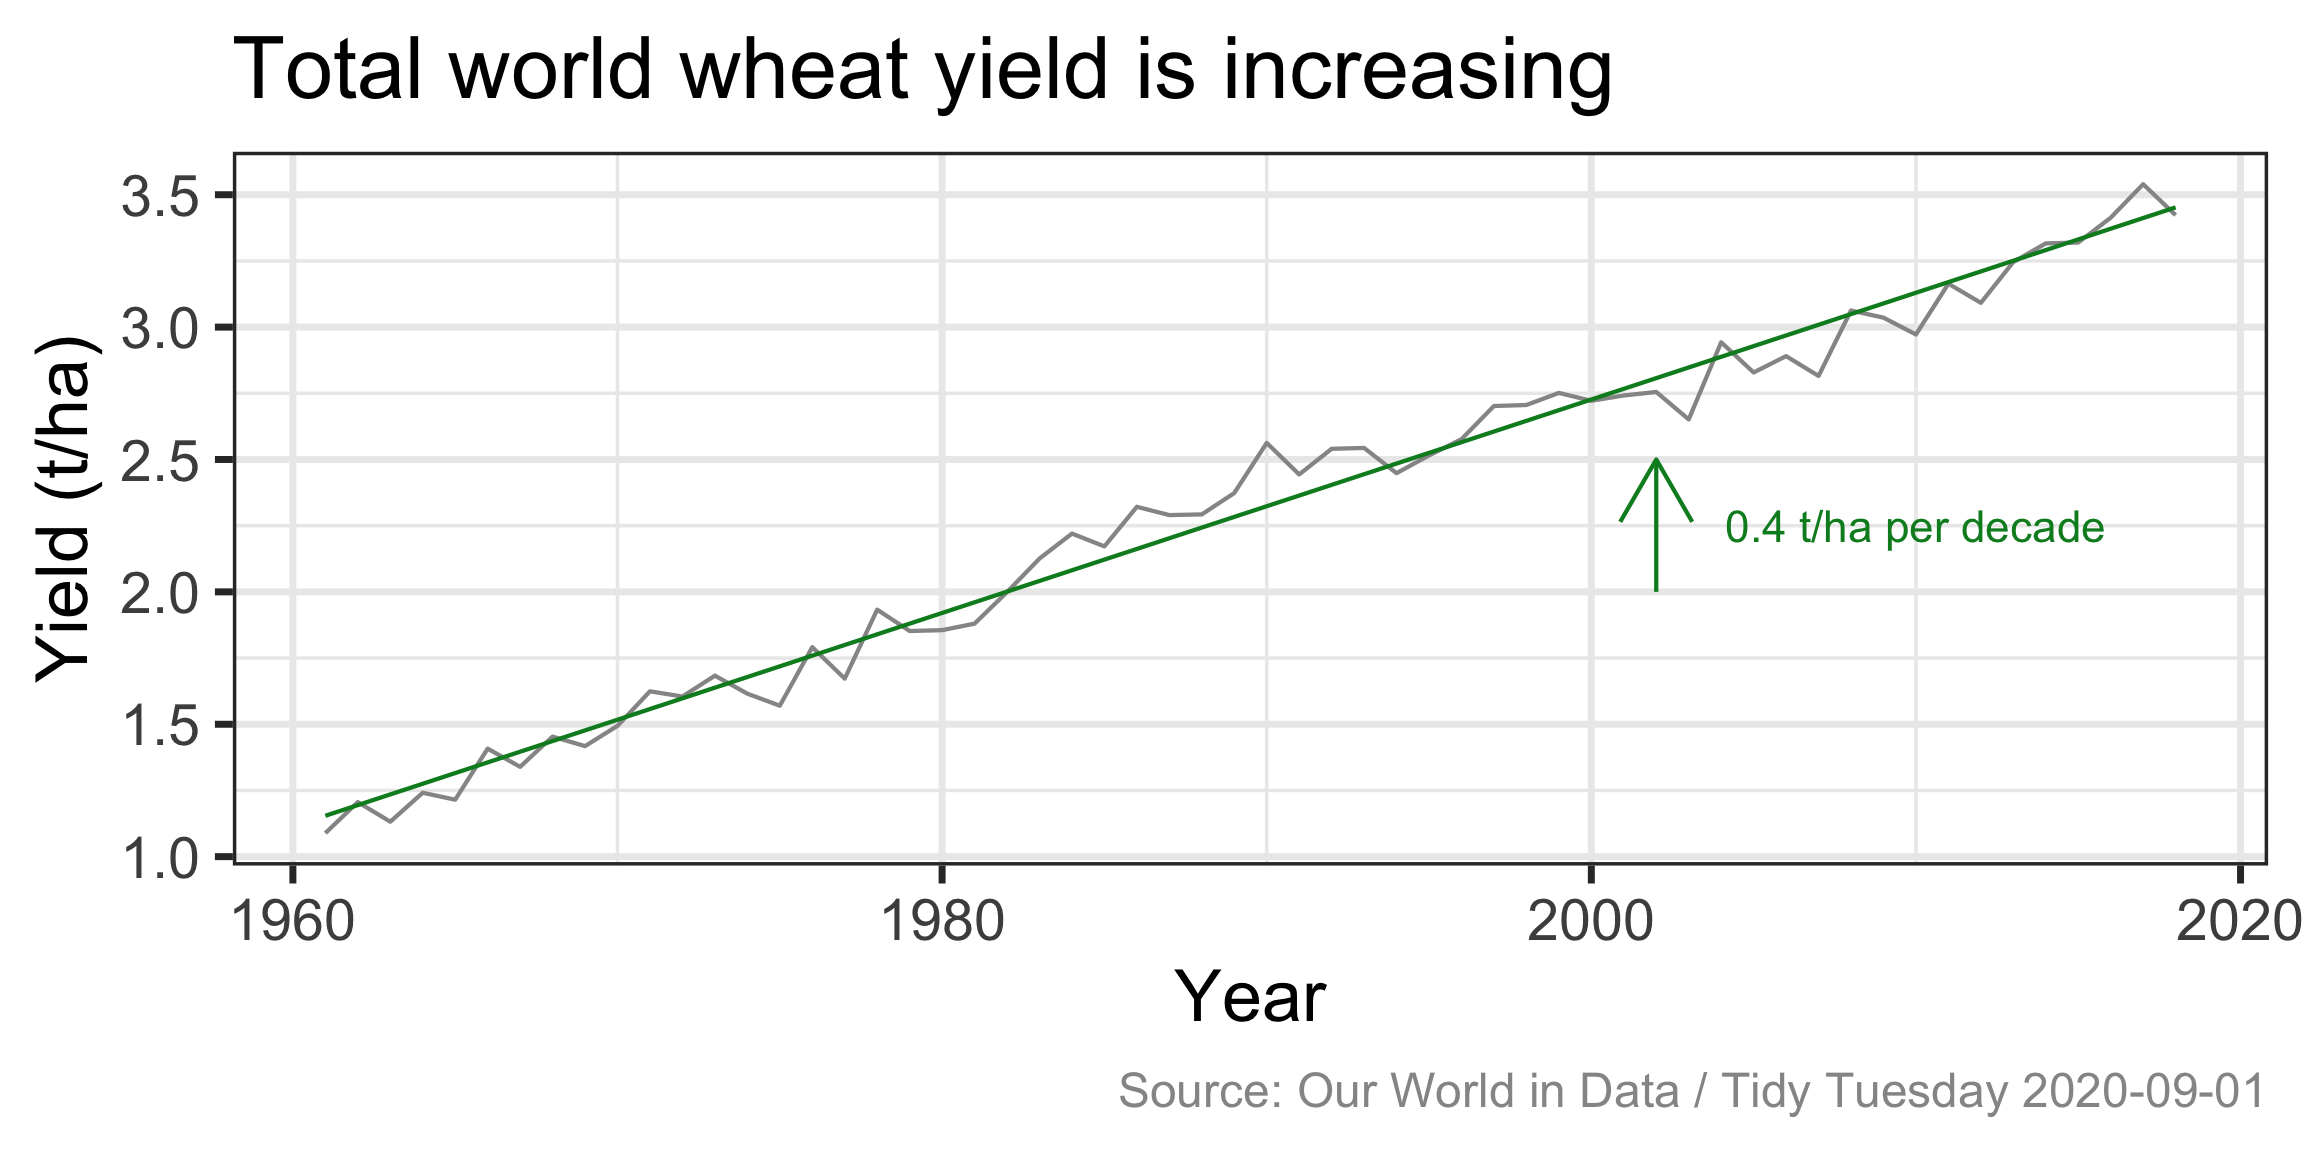
 Change over time
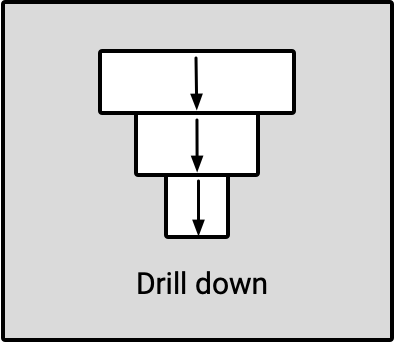
 Drill down
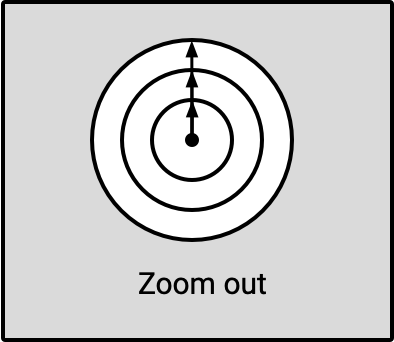
 Zoom out
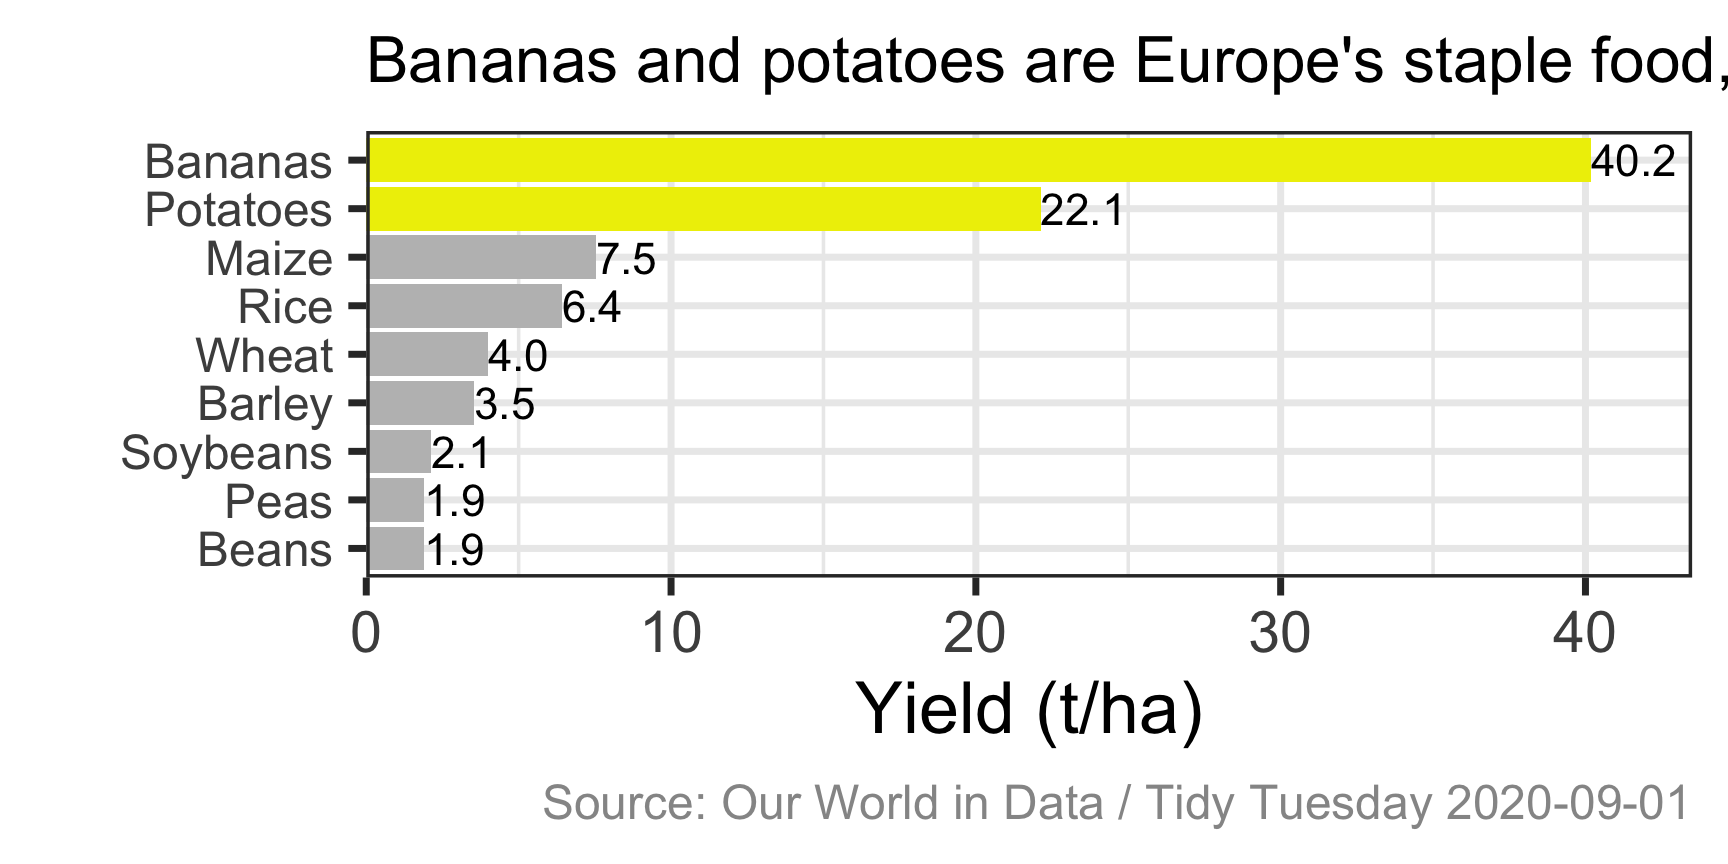
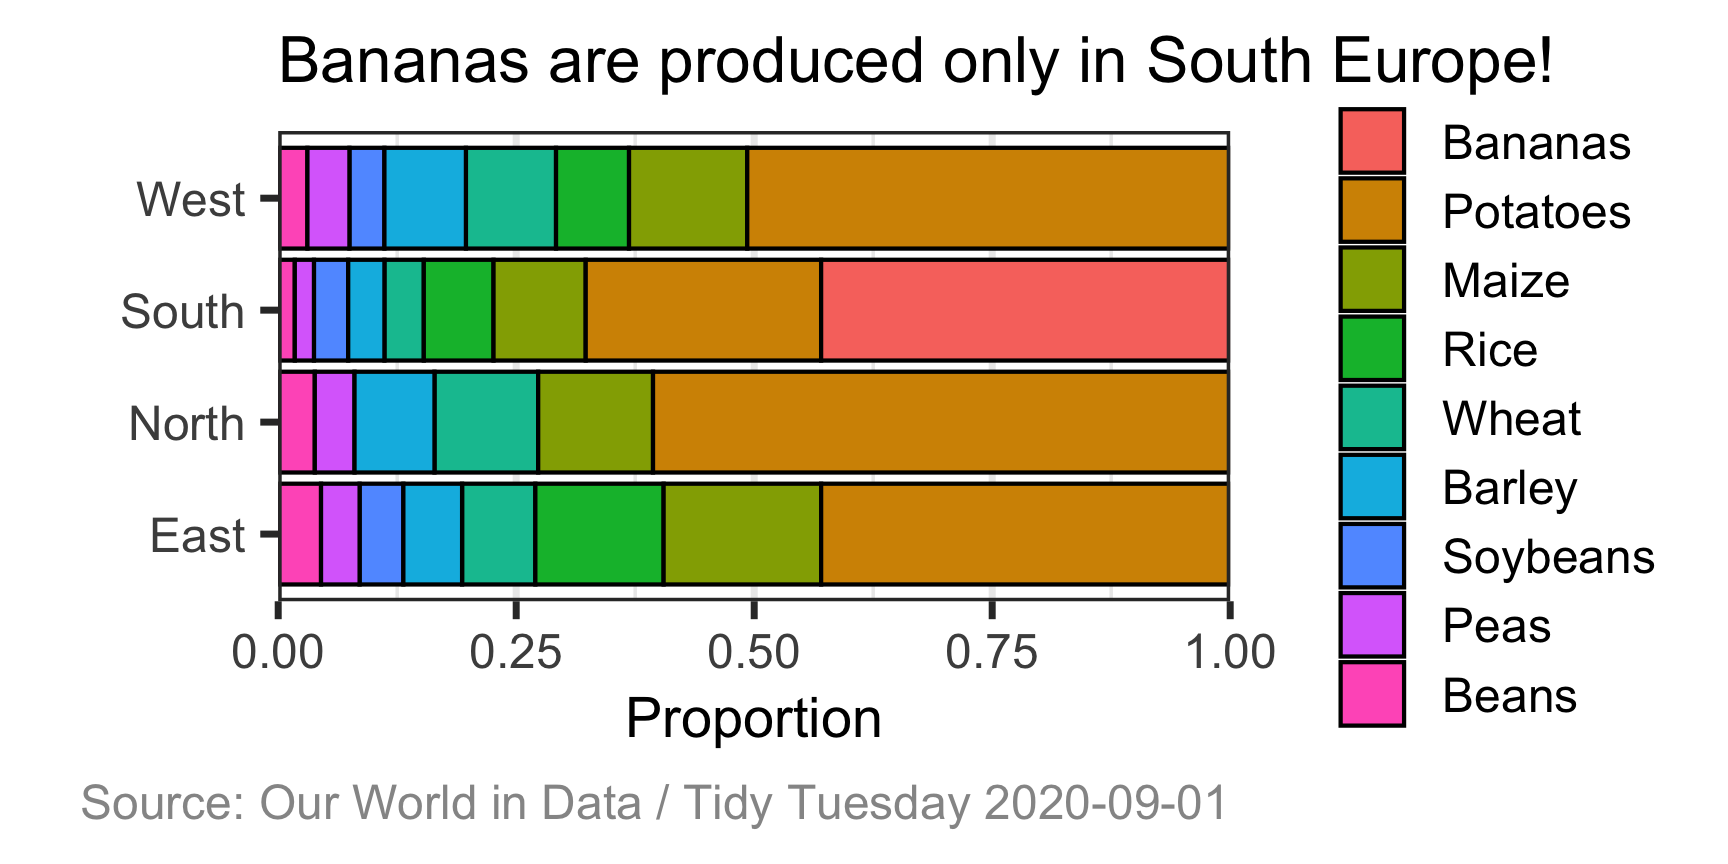
 Contrast
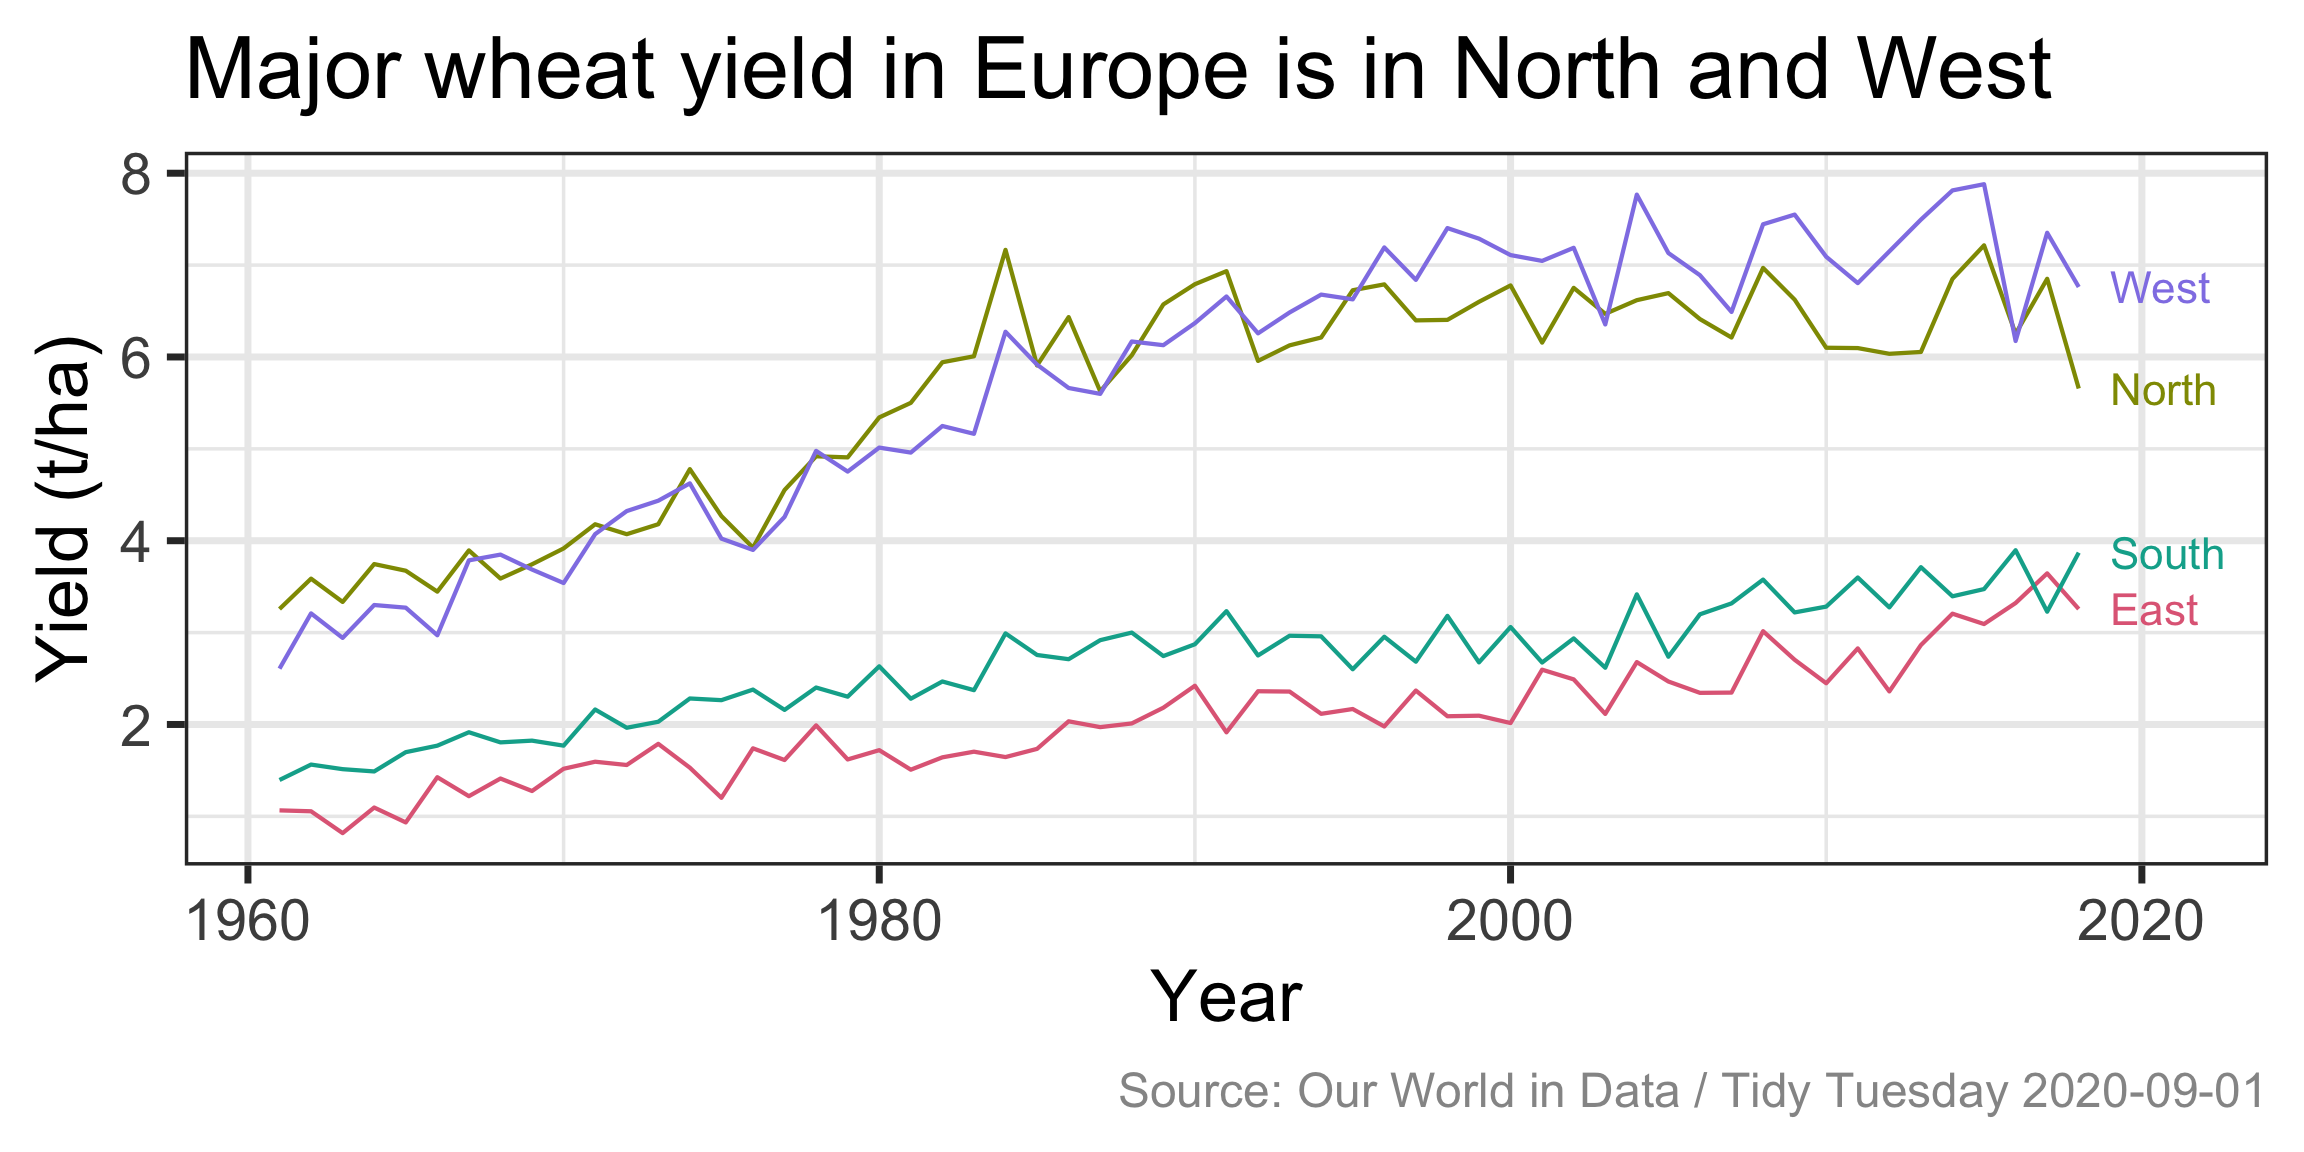
 Factors
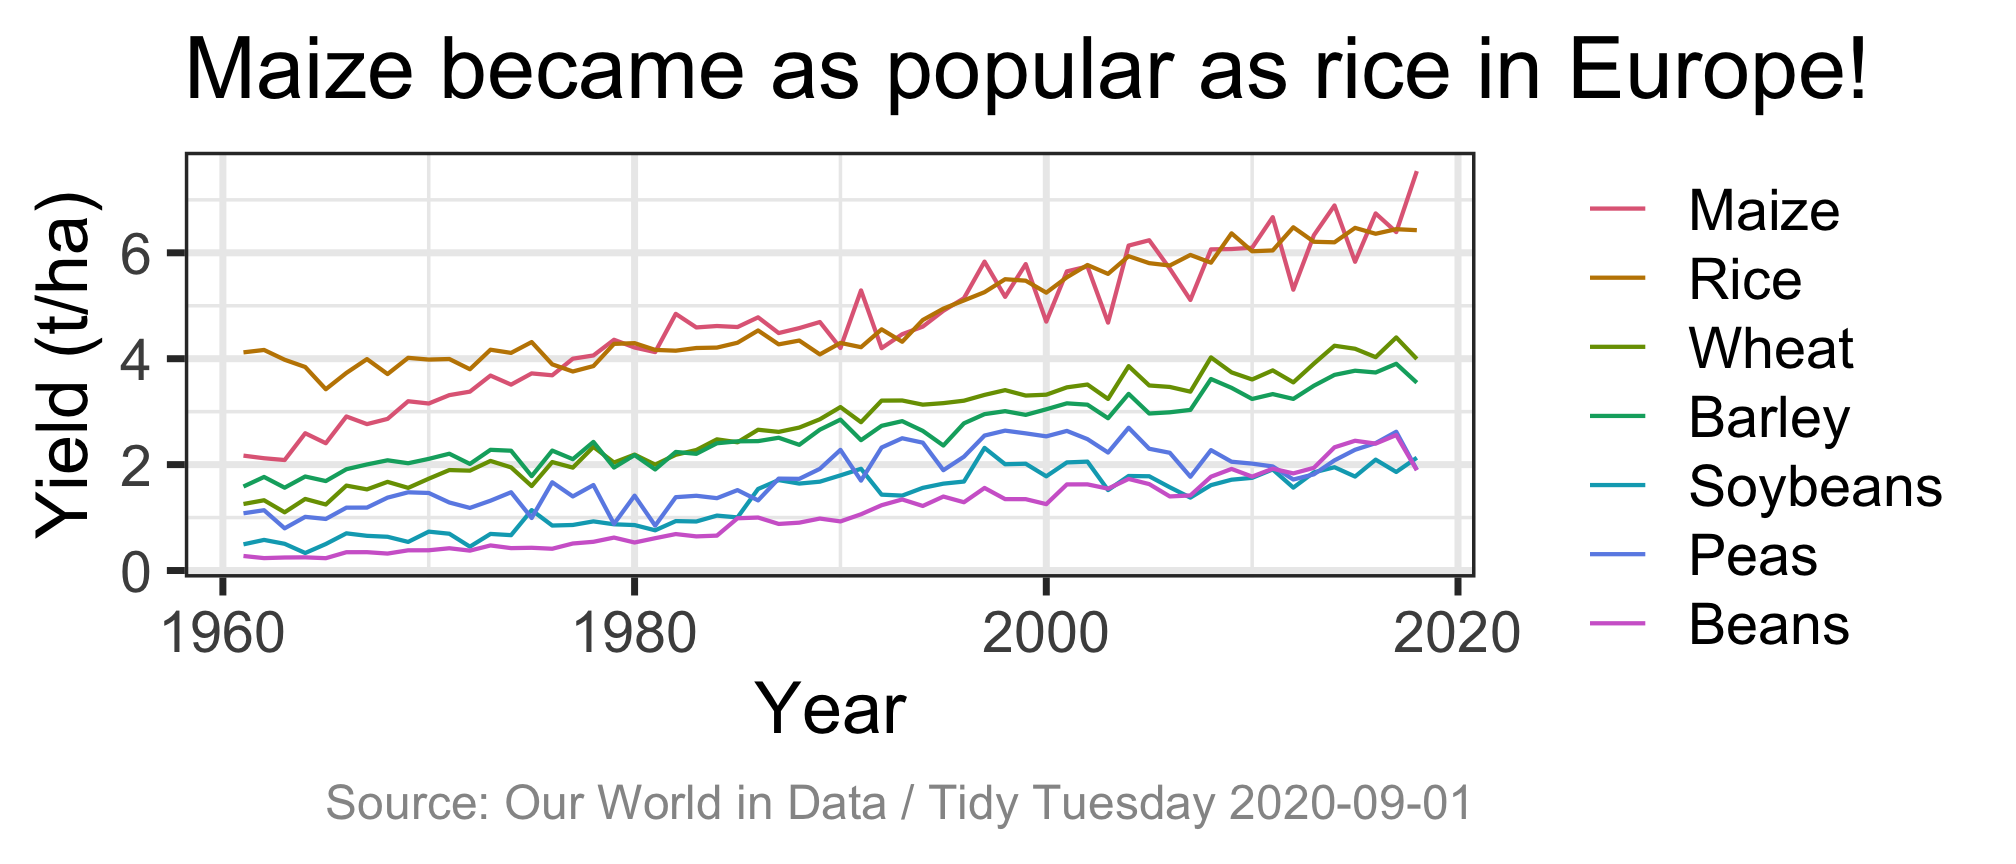
 Intersections
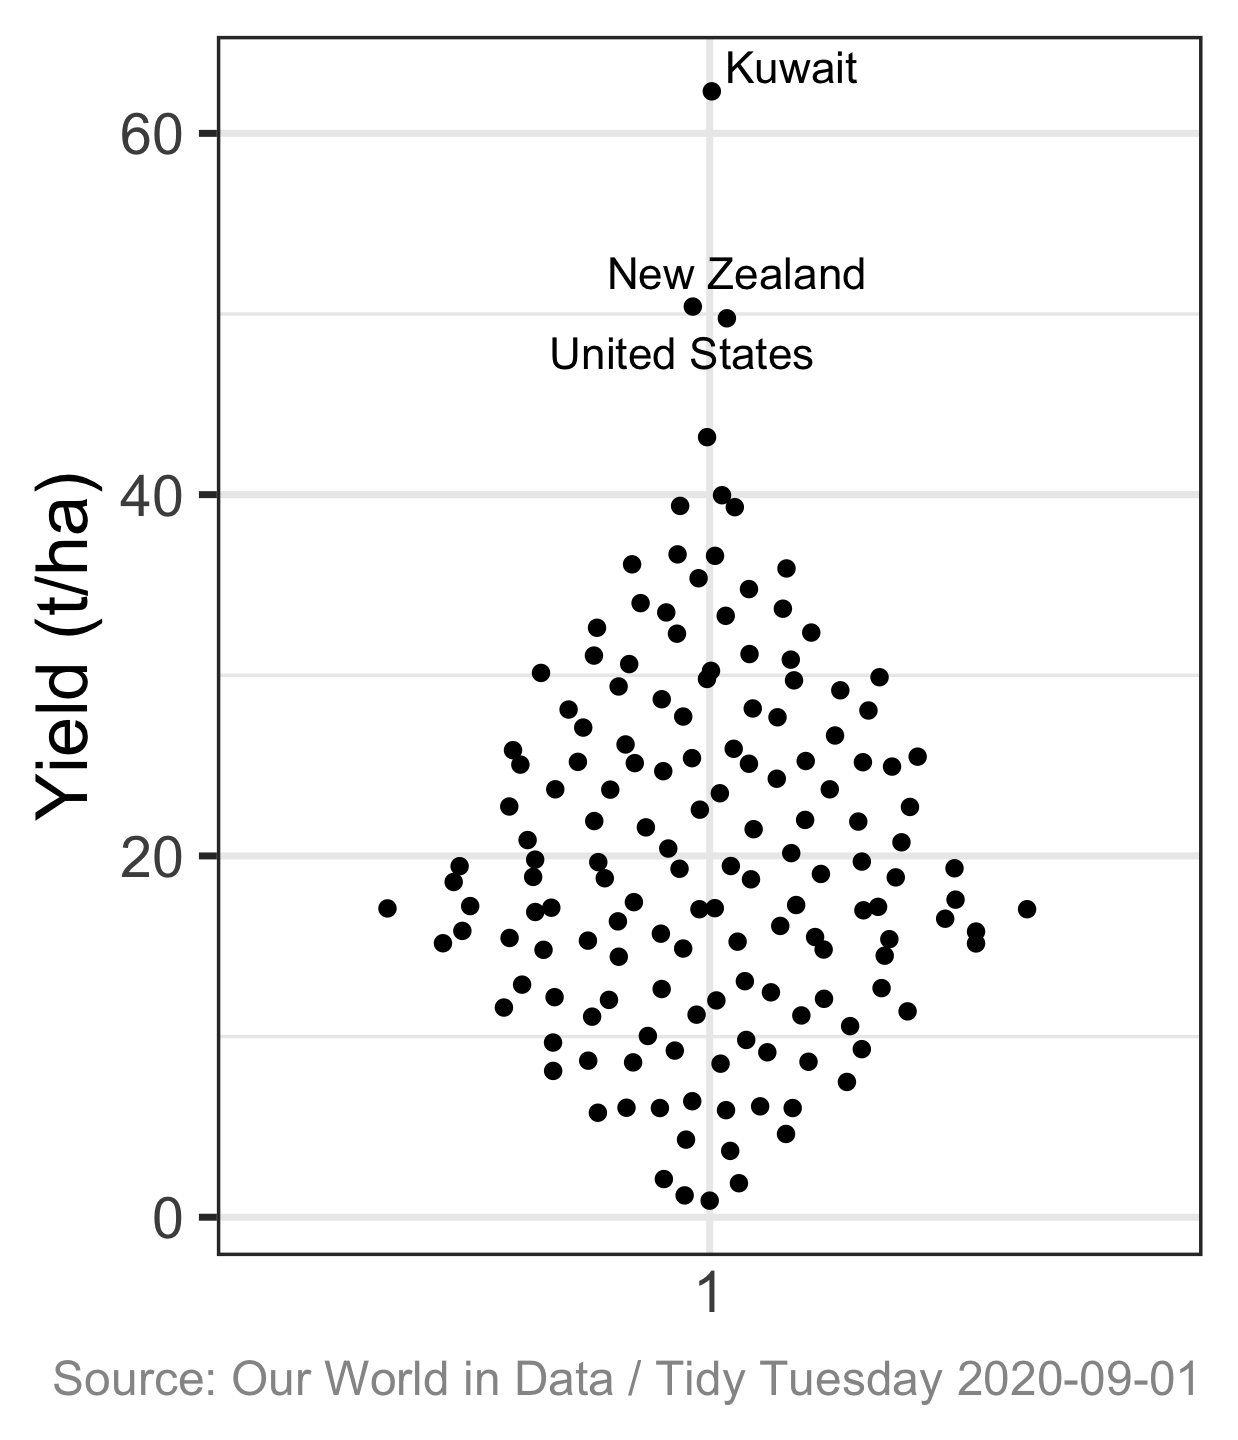
 Outliers
Kuwait, NZ & USA have highest potato yields, 2018
Narrative structure


Week 10 Lesson
Summary
- Storytelling is a powerful technique to communicate data
- Compose effective data stories requires you to
- know your the goals (audience, message, desired effect),
- selecting appropriate data, visualisations and aesthetic designs, and
- receiving feedback.
Resources
- Spencer (2022, Feb. 17). Data in Wonderland. Section 1.
- Jones (2014) Communicating Data with Tableau