ETC5523: Communicating with Data
Communicating data with interactive web apps
Lecturer: Emi Tanaka
Department of Econometrics and Business Statistics
Aim
- Use interactivity to enable data exploration, understanding and communication
- Design web apps with displays that fit for the purpose
- Make web applications using
shiny
Why
Interactive web apps can
- connect people and data,
- make systems playful,
- prompt self-reflection,
- personalise the view, and
- reduce cognitive load.
Human Computer Interaction
Open-ended dialogue between the user and the computer
- Enable audience to some degree co-author narrative, i.e. narratives moves away from being author-guided to audience-driven.
- Leverage user interaction techniques to improve user experience, e.g.
- Show details on demand
- Reduce overall cognitive load
- Personalised view
User Interactions

Image from Spencer (2022, Feb. 17). Data in Wonderland. Retrieved from https://ssp3nc3r.github.io/data_in_wonderland
User Inputs

Image from Spencer (2022, Feb. 17). Data in Wonderland. Retrieved from https://ssp3nc3r.github.io/data_in_wonderland
Criteria for the Design of Interactive Data Visualisation
Tominski, Christian, and Heidrun Schumann (2020) Interactive Visual Data Analysis. CRC Press.
Quality criteria
Expressiveness (Mandatory Condition)
An interactive visual representation is expressive if it allows the user to carry out the actions needed to acquire the desired information in the data.
Effectiveness (Goal-Oriented Condition)
A measure of how well the user can convey an interaction intent to the computer.
Efficiency (Desired Condition)
The balance of benefits and costs for using an interactive visualisation approach. E.g. does the human effort of building the interactive visualisation outweigh its benefits? Are the efforts of users to interact with it offset the information gained for users?
Goals
- Exploration promotes undirected search
- Description characterises observations by associated data elements
- Explanation identifies contributing causes behind an observation
- Confirmation find concrete evidences for or against a hypothesis
- Presentation communicates results of a confirmed analysis
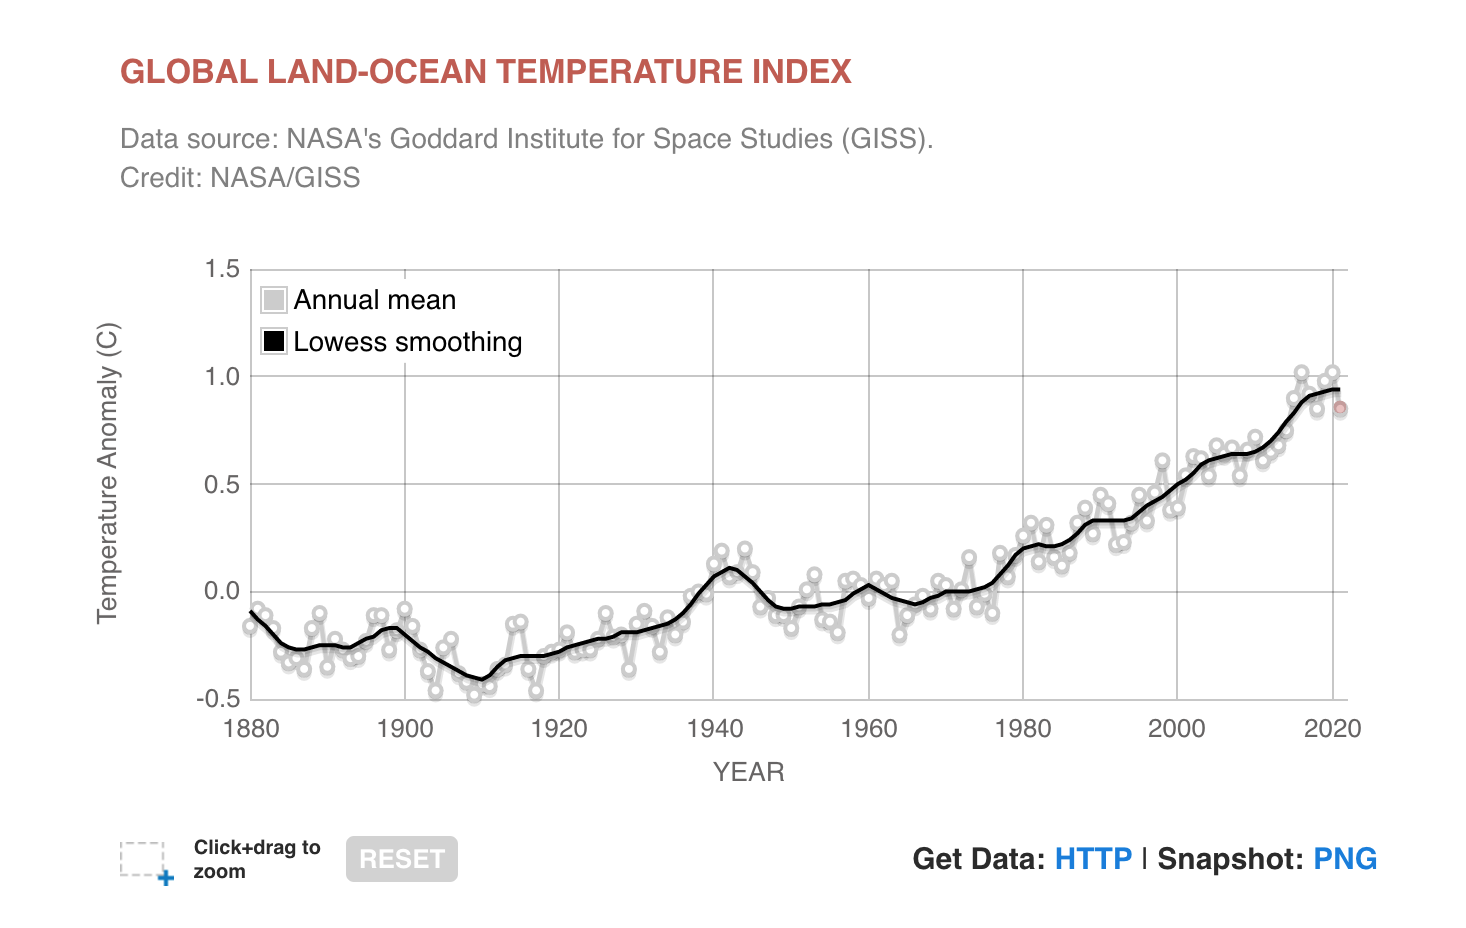
Example: Global Temperature
https://climate.nasa.gov/vital-signs/global-temperature/
Example: Handwriting with Neural Network
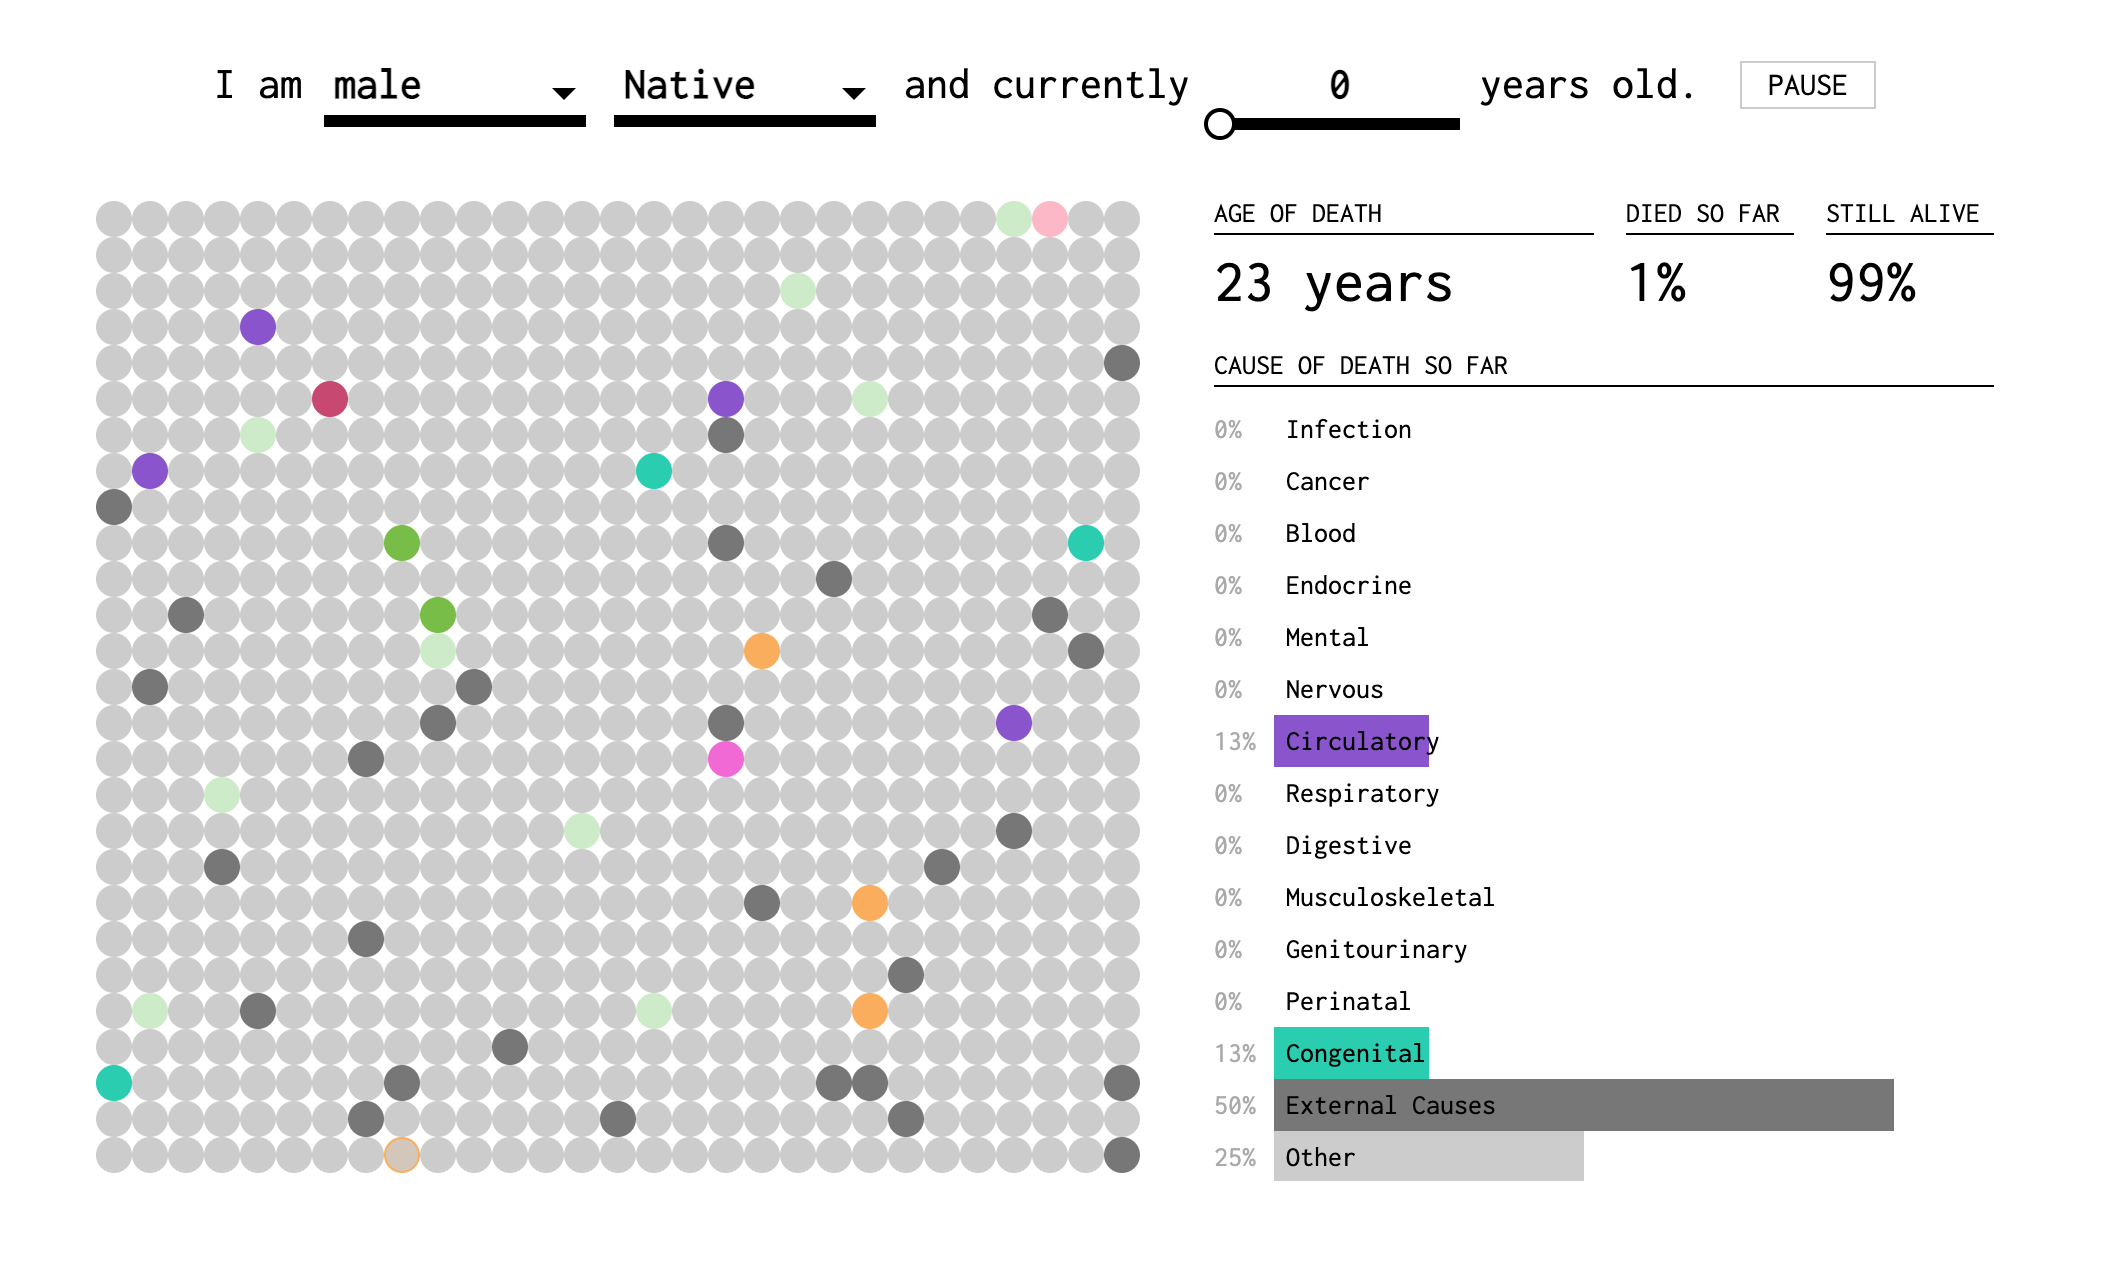
Example: How you will die
https://flowingdata.com/2016/01/19/how-you-will-die/
What is shiny?
How to get started with shiny?
- RStudio > File > New File > Shiny Web App…
- Using snippet: Type
shinyappand Shift + Tab
User Interface
Writing HTML from R
library(shiny) # exported from `htmltools`
tags$html(
  tags$body(
    h1('My first heading'),
    p('My first paragraph, with some ', strong('bold'), ' text.'),
    div(id = 'myDiv', class = 'simpleDiv',
        'Here is a div with some attributes.')
  )
)- Use
includeCSS()andincludeScript()to include CSS and JS files
HTML Inputs Part 1
HTML Inputs Part 2
HTML Input Part 3
Layouts
fluidRow + columns
This is using bootstrap
fluidPage(
  fluidRow(column(width = 4,
                  h3("Some informative table"),
                  tableOutput("mytable")),
           column(width = 4, offset = 3,
                  h3("Fancy plot"),
                  plotOutput("myplot"))),
  fluidRow(column(width = 12,
                  "Minimum width is 1 and maximum width is 12"))
)
<div class="container-fluid">
<div class="row">
<div class="col-sm-4">
<h3>Some informative table</h3>
<div id="mytable" class="shiny-html-output"></div>
</div>
<div class="col-sm-4 offset-md-3 col-sm-offset-3">
<h3>Fancy plot</h3>
<div id="myplot" class="shiny-plot-output" style="width:100%;height:400px;"></div>
</div>
</div>
<div class="row">
<div class="col-sm-12">Minimum width is 1 and maximum width is 12</div>
</div>
</div>sidebarLayout
fluidPage(sidebarLayout(
  sidebarPanel(h3("User control"),
               actionButton("id1", "Push")),
  mainPanel(h3("Main Panel"),
            plotOutput("myplot"))
))
<div class="container-fluid">
<div class="row">
<div class="col-sm-4">
<form class="well" role="complementary">
<h3>User control</h3>
<button id="id1" type="button" class="btn btn-default action-button">Push</button>
</form>
</div>
<div class="col-sm-8" role="main">
<h3>Main Panel</h3>
<div id="myplot" class="shiny-plot-output" style="width:100%;height:400px;"></div>
</div>
</div>
</div>Server & Client Communication
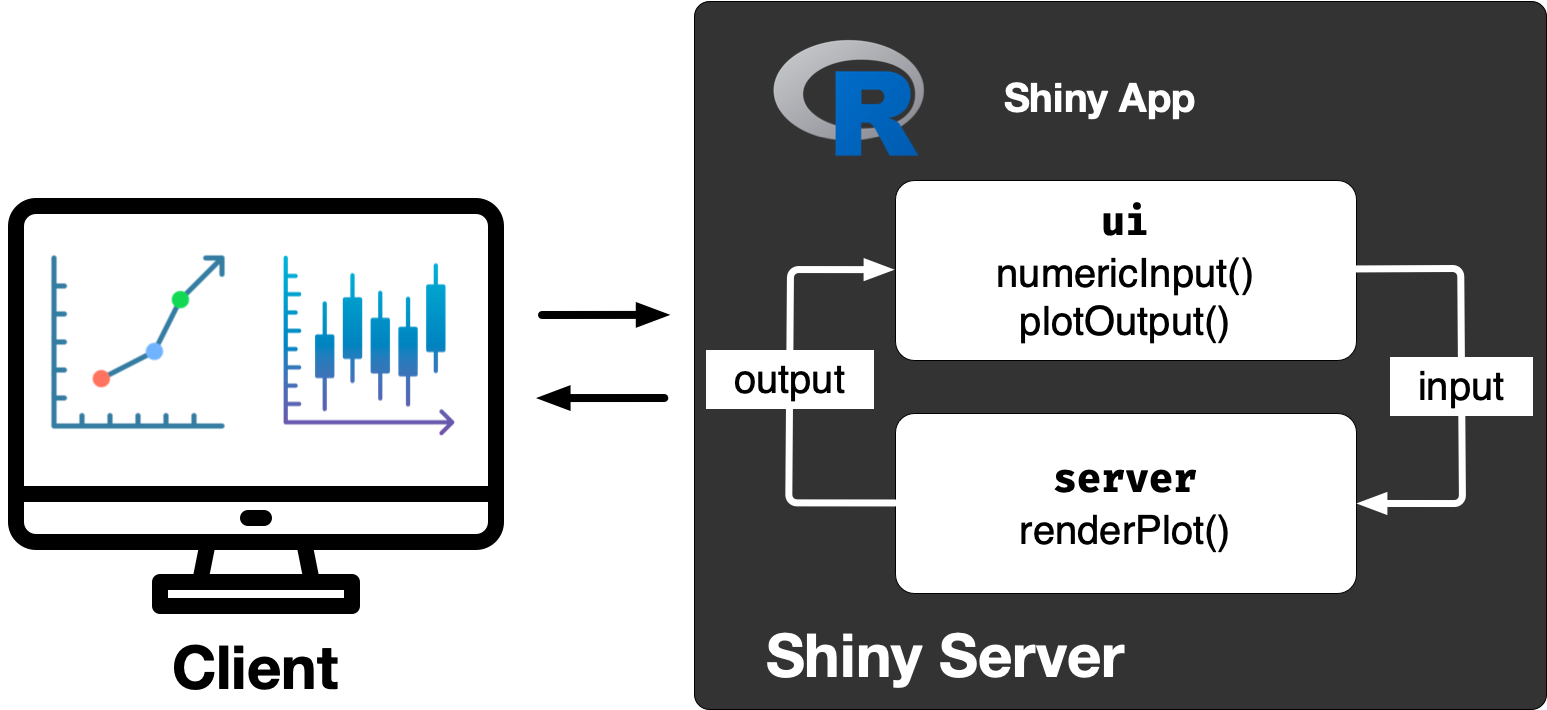
Server and User Interface Outputs
| server | ui |
|---|---|
renderDataTable |
dataTableOutput |
renderImage |
imageOutput |
renderPlot |
plotOutput |
renderPrint |
verbatimTextOutput |
renderTable |
tableOutput |
renderText |
textOutput |
renderUI |
uiOutput or htmlOutput |
Reactivity
reactiveValuescreates your own reactive valuesisolateprevents reactionsreactivecaches its value to reduce computation and notifies its dependencies when it has been invalidatedobserveEventruns code when the first argument changesobserveruns code when any reactive elements within it changes
Debugging
browser()+ breaking points
How to deploy your Shiny app?
Week 3 Lesson
Summary
- We went through the benefits of interactivity for communicating data
- We considered how to design displays for web apps
- You learnt how to use make web apps using
shiny
Resources
- Hohman, et al., “Communicating with Interactive Articles”, Distill, 2020.
- Introduction to Shiny Tutorials Course Mastering Shiny
- Debugging Shiny Techniques Article
- Cheatsheet for Shiny Cheatsheet

ETC5523 Week 3