FAQ and wrap-up
Data Visualisation with R
👩🏻💻 Emi Tanaka @ Monash University
- emi.tanaka@monash.edu
- @statsgen
- github.com/emitanaka
- emitanaka.org
28th November 2022 Australasian Applied Statistics Conference 2022
File formats
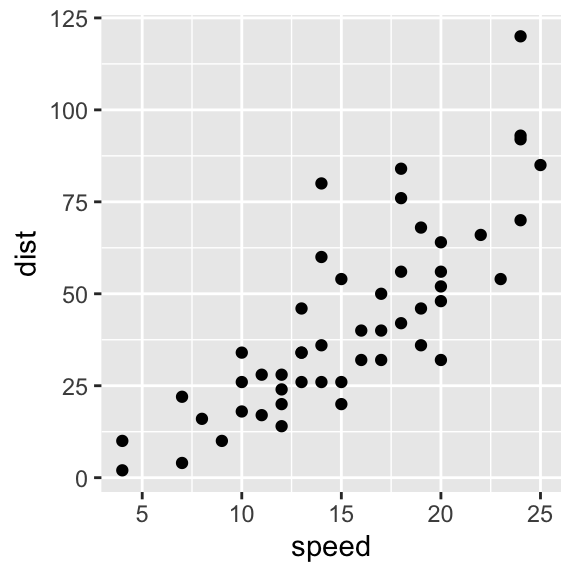
Are these figures different?

Both figures used the same code below to produce the figure:
ggplot(cars, aes(speed, dist)) + geom_point()
but I saved one to a png file and the other as a svg file.
Communicating Figures
- There are two main formats for graphics:
- Raster formats contain description of each pixel. Common formats are:
jpg(orjpeg) uses a lossy data compression that results in some loss of information but usually a small file size.pnguses a lossless data compression and works well if the image has uniform colors.
- Vector formats contain a geometric description and hence render smoothly at any display size. Common formats include
svg,pdfandeps. E.g. svg and its source.
- Raster formats contain description of each pixel. Common formats are:
- A vector format scales well to any display size, however, the file size may become prohibitively big when there are many geometric objects (i.e. displaying many data).
Exporting plots
- To export plots made by
ggplot2, useggsave().
- Unfortunately you may need to adjust the font size when you check the exported plot!
Interactive plots
Interactive plots
plotlytranslatesggplotobjects intoplotlyinteractive graphics.
- This doesn’t work well for some (usually complex) type of plots.
Interactive plots with JS through R
- State-of-the-art for interactive plots is JS
- No need to learn JS!
- Many JS library for plotting are available via an R package:
3D plots
3D plots
ggplot2is best for static 2D plots
- For 3D plots, you may like to use some modern interactive tools instead
Resources
For continued learning
Community
Learn with others!
Keep a local copy of the workshop material!
> Download the zip file here
> Open the docs/index.html in a browser