'data.frame':   412 obs. of  5 variables:
 $ plot   : Factor w/ 48 levels "1988F1","1988F2",..: 1 1 1 1 1 1 1 1 1 1 ...
 $ variety: Factor w/ 2 levels "F","P": 1 1 1 1 1 1 1 1 1 1 ...
 $ year   : int  1988 1988 1988 1988 1988 1988 1988 1988 1988 1988 ...
 $ day    : int  14 21 28 35 42 49 56 63 70 77 ...
$ weight : num 0.106 0.261 0.666 2.11 3.56 ...facet_wrap()
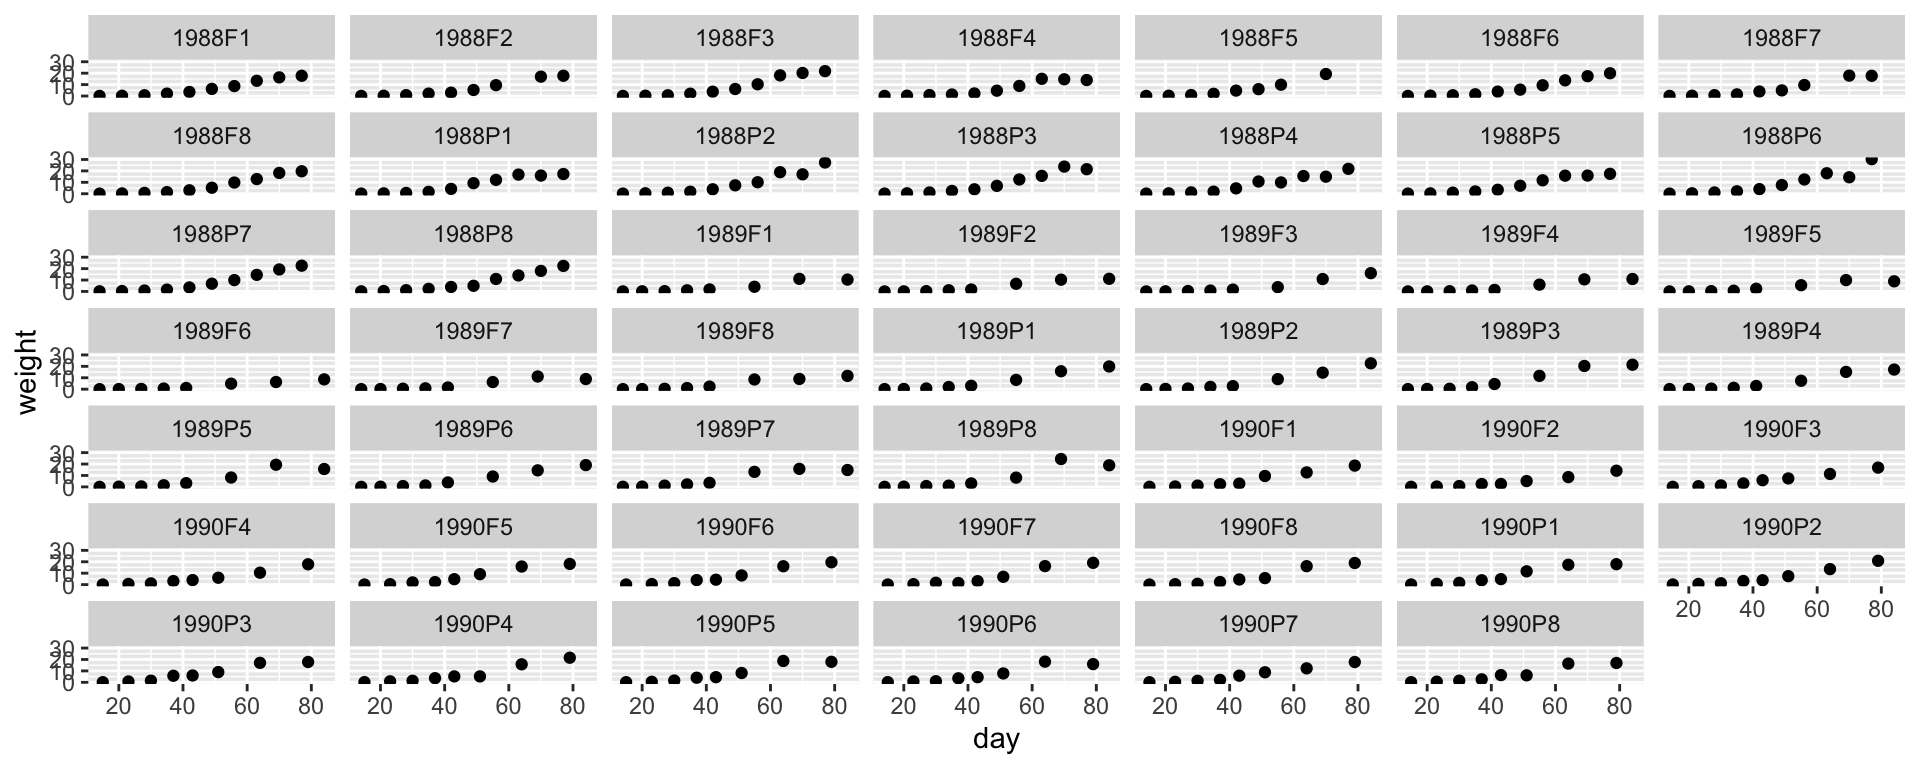
facet_wrap()divides the data into mutually exclusive subset based on the input variable and create subplots based on the data in the corresponding panel.

Wrapping many panels
facet_wrap“wraps” the panels into 2d if you have many panels
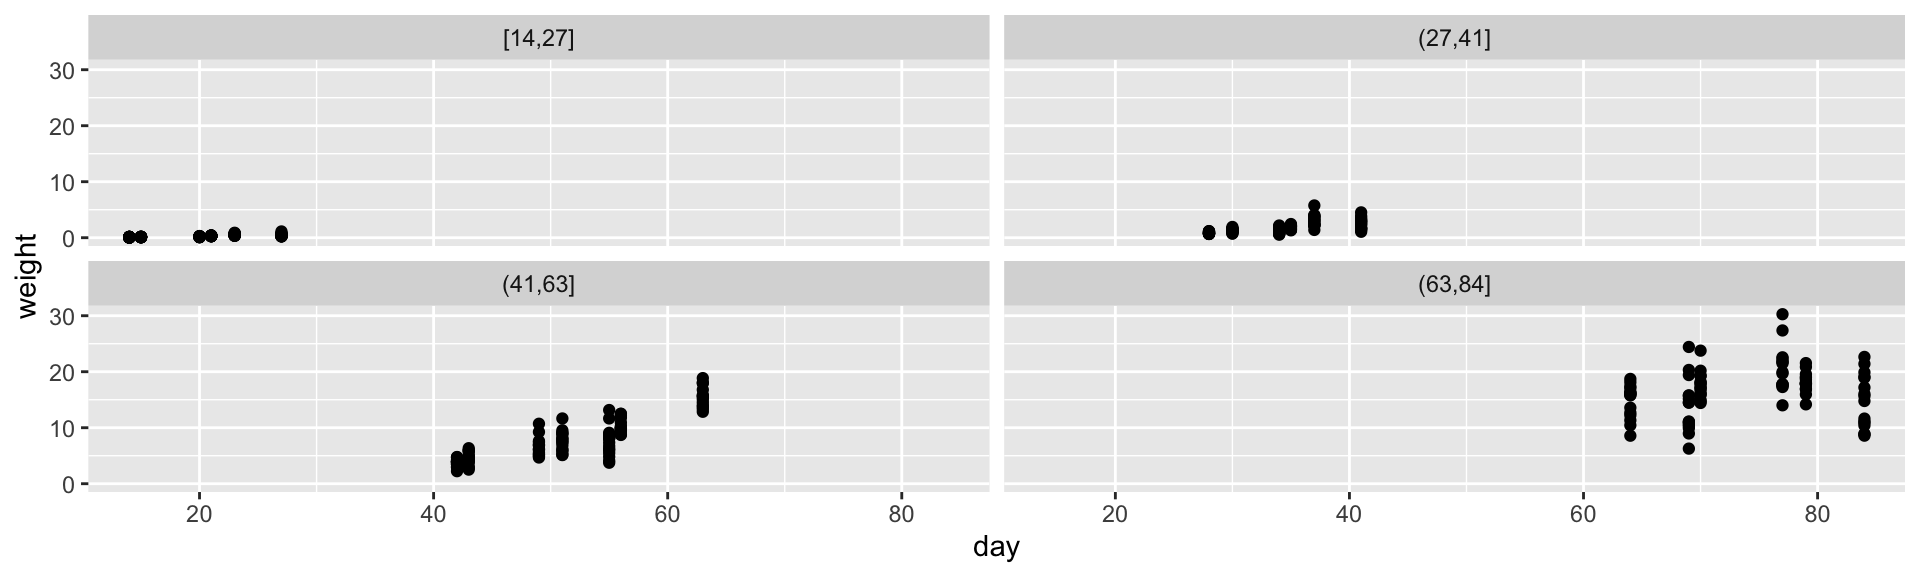
Wrapping by a continuous variable
- Discretize continuous variable using
cut(),cut_width(),cut_interval()orcut_number().
Changing the scales for each panel
- By default the scales are shared across the panels but you can choose to have scales built independently for each panel:
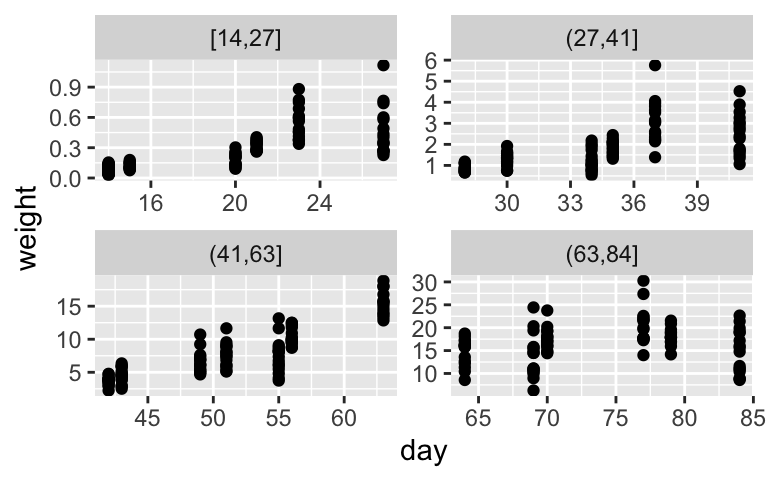
- If you want the scale to be independent only in one dimension then you can use
scales = "free_x"andscales = "free_y".
Wrapping with more than one variables
- If you want to wrap the facet by more than one variable, you can combine the variables by using
+:
- Alternatively, you can use
vars()instead of+.
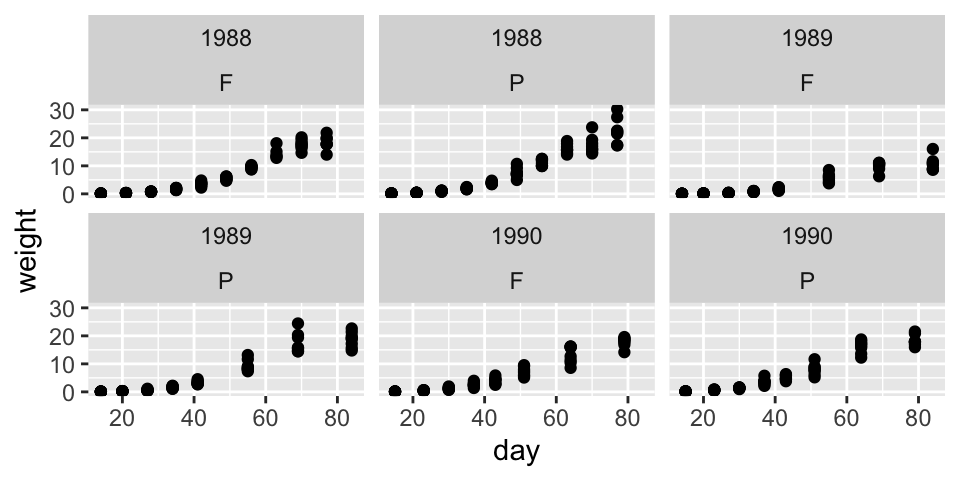
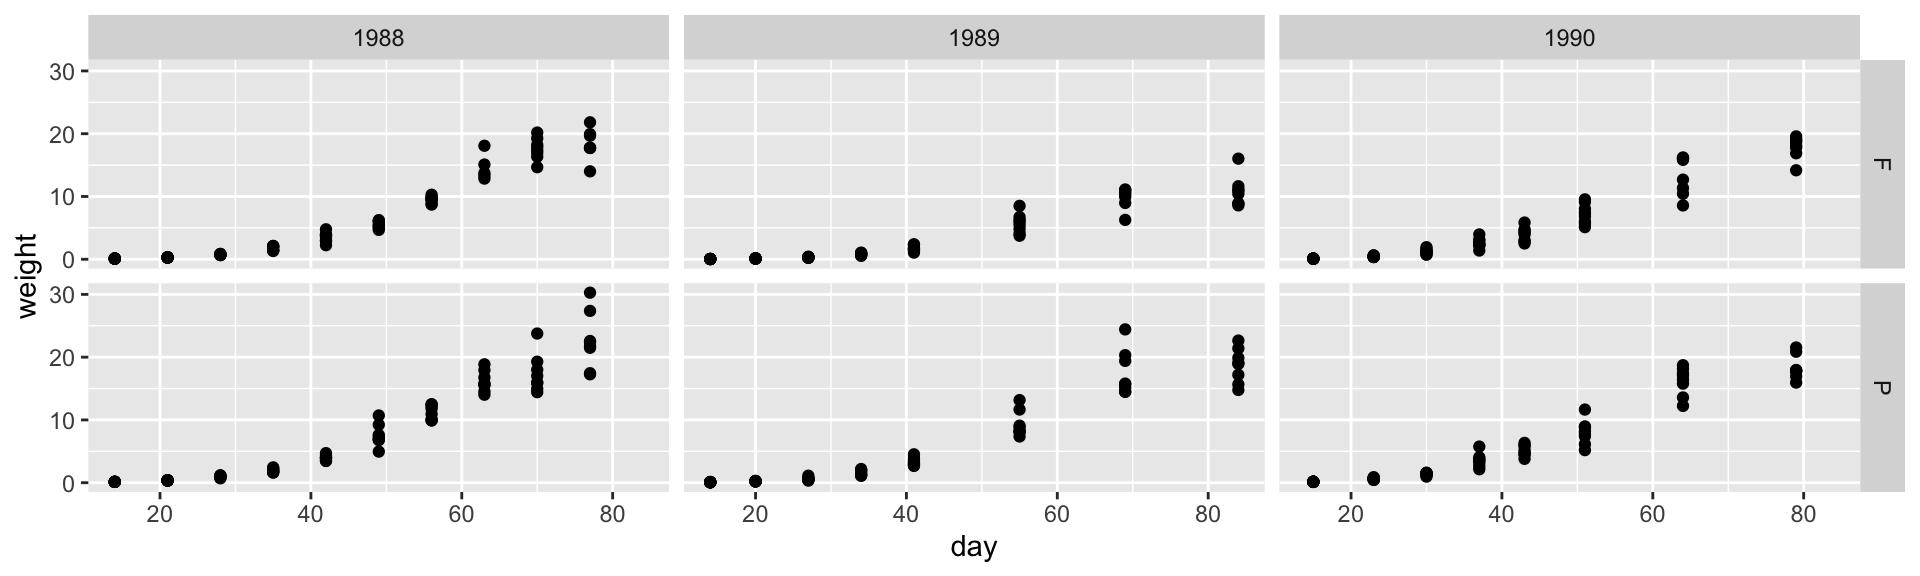
facet_grid()
- Alternatively, you can use
facet_grid()to lay out the panels in a 2d grid:
Missing facet variables
- If a layer data is missing the faceting variable(s), then the layer will be shown across all panels based on all of the layer data
ggplot(davidian.soybean, aes(day, weight)) +
  geom_point(data = function(.data) select(.data, -c(variety, year)), color = "grey70") +
  geom_point() +
  facet_grid(variety ~ year)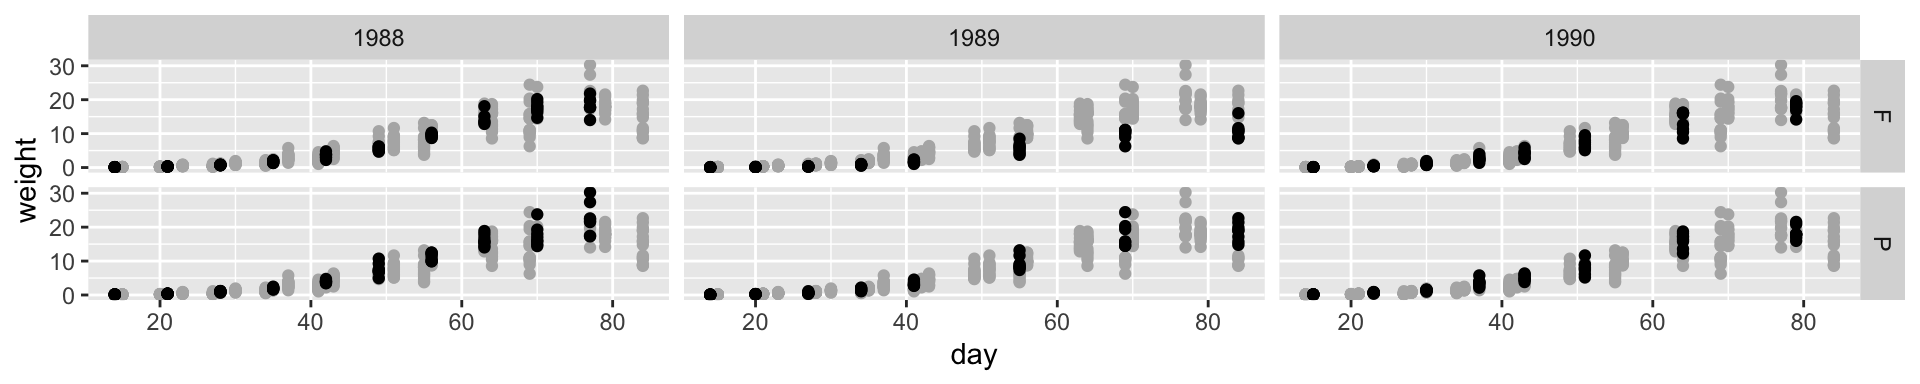
- This is a nice way to creating a “shadow” across all panels.
Demo with patchwork
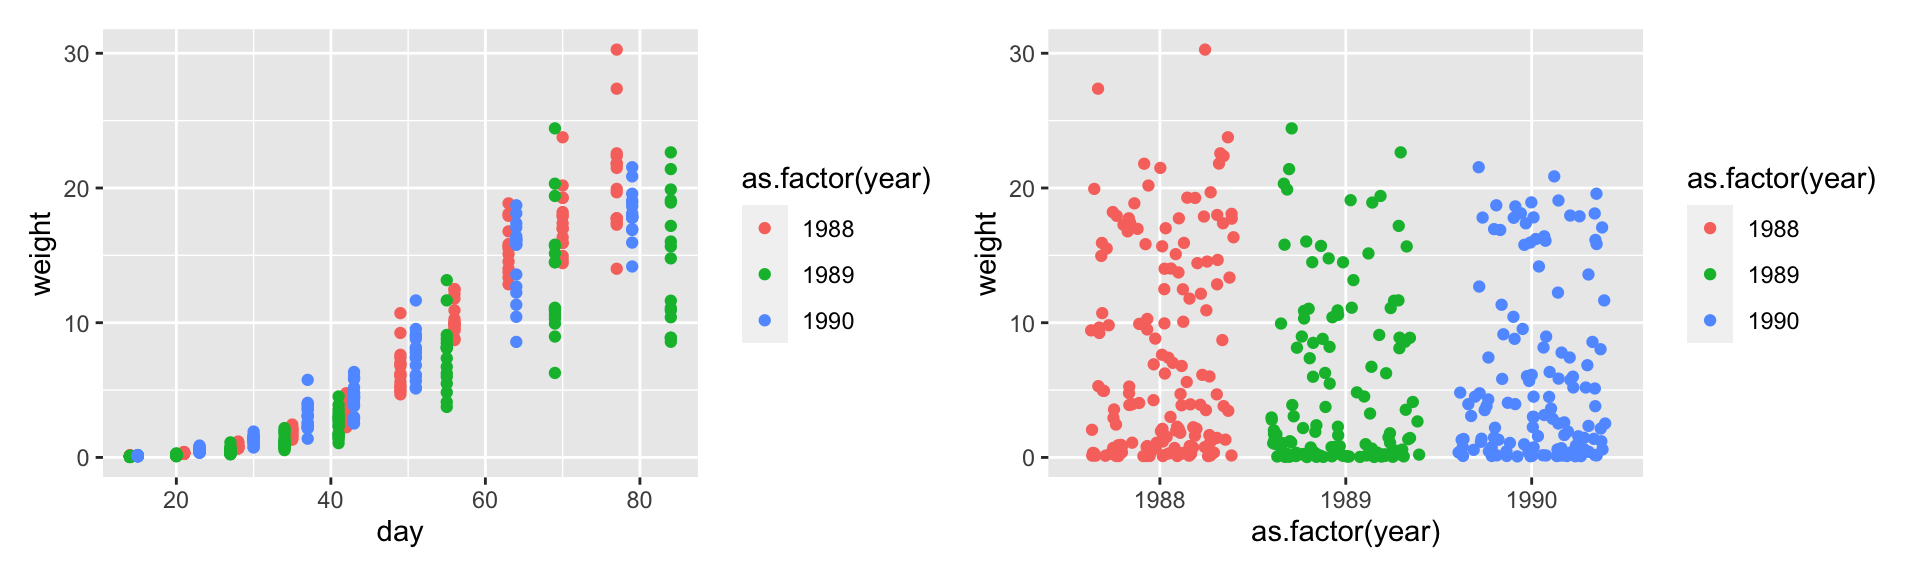
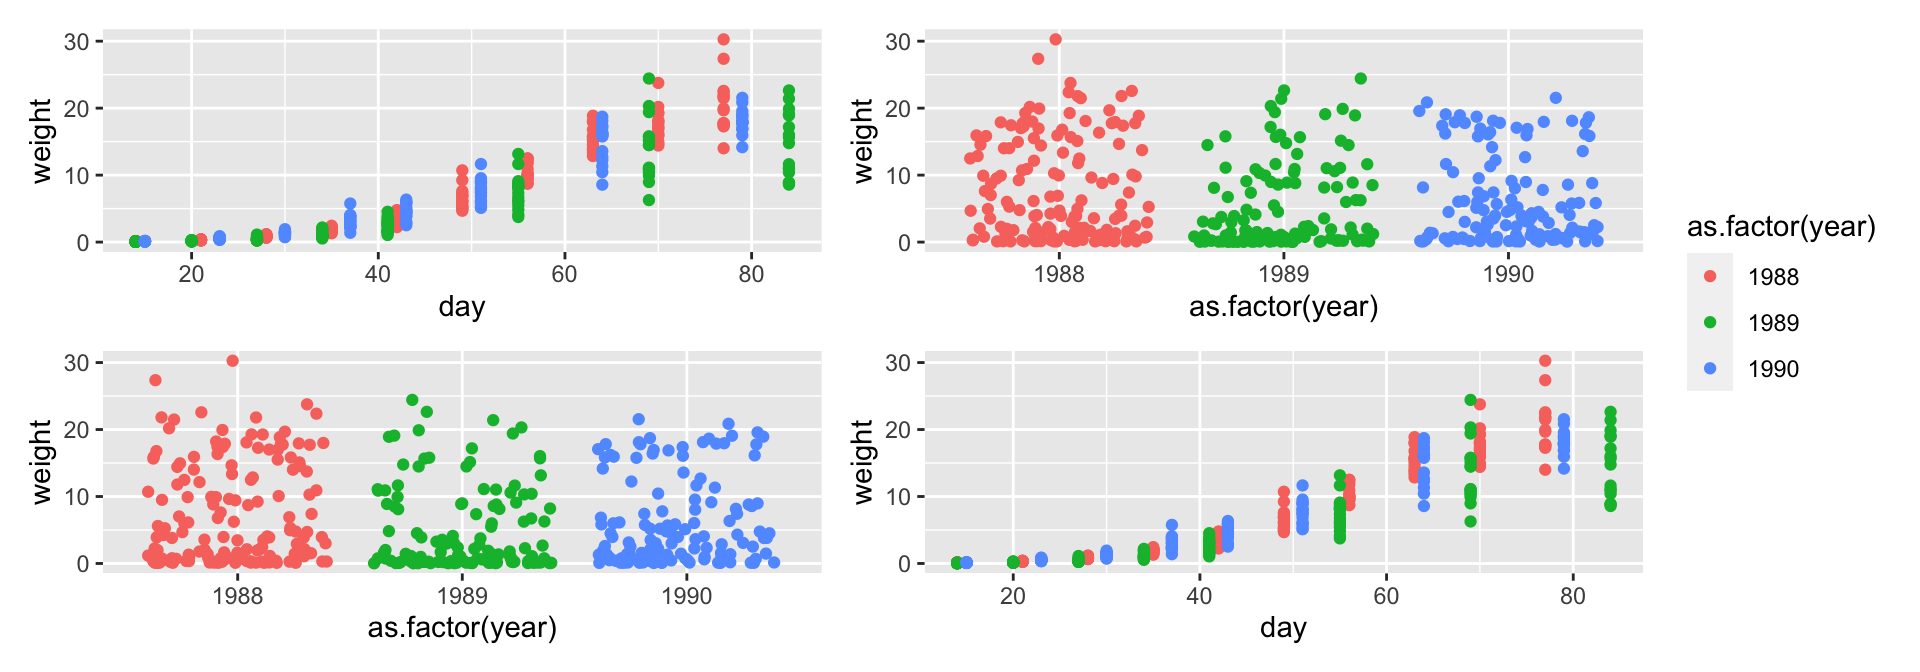
Combining plot layouts
patchworkcan collect the same guides across the plots as well as automatically add tag labels
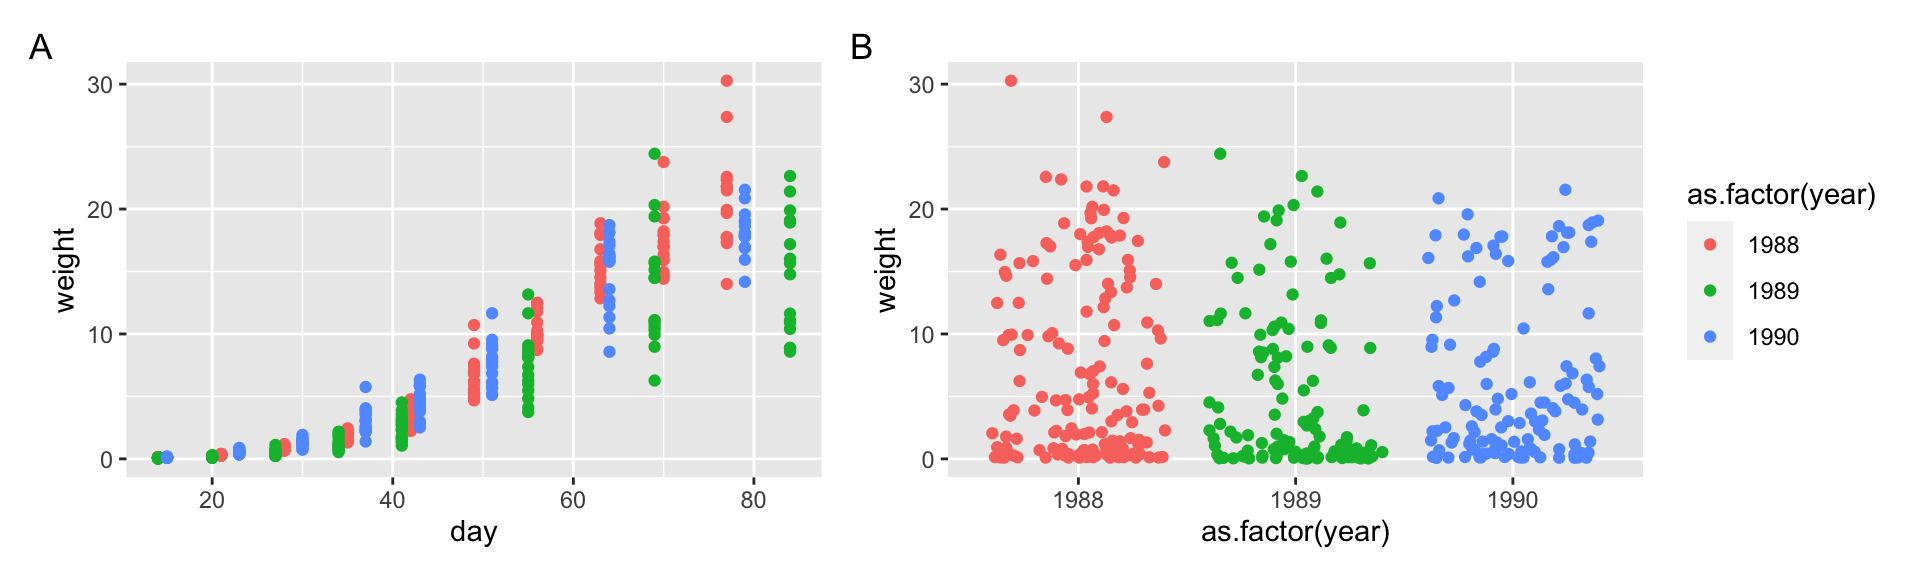
Plot layout
- You can combine the use of
+and/to layout plots horizontally or vertically using()to group rows or columns
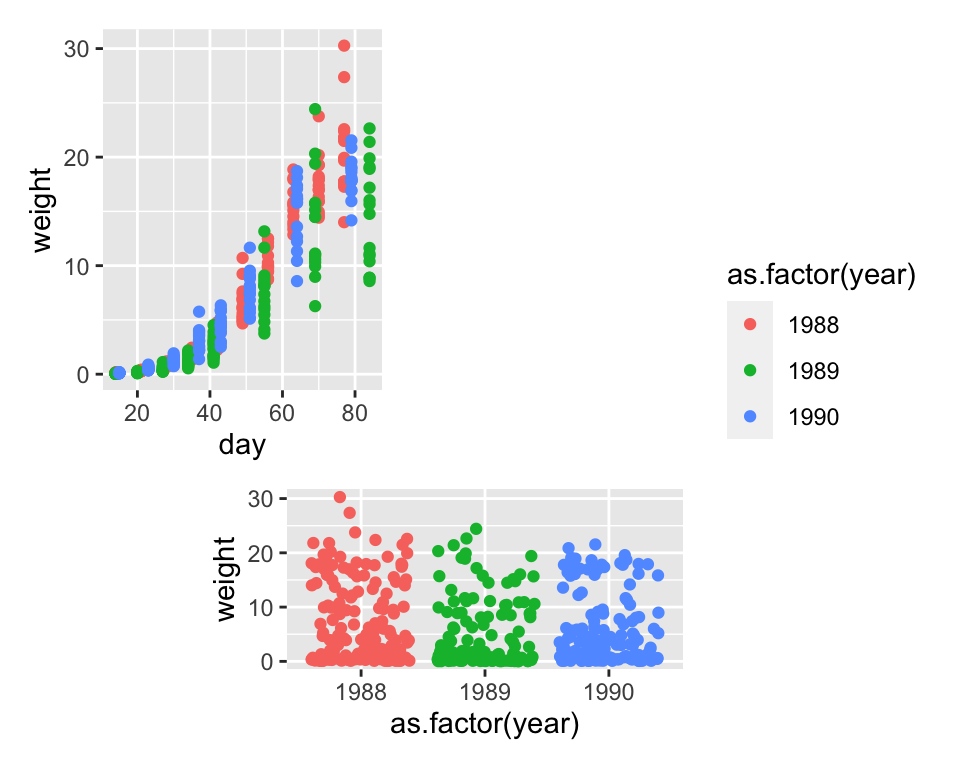
Flexible plot layout
- If you want even more control over the plot layout, then you can specify a string with the structure you want like below:
Time to code!
15:00
> Go to emitanaka.org/dataviz-workshop/exercises/
> Click Exercise 6