R graphics
Data Visualisation with R
👩🏻💻 Emi Tanaka @ Monash University
-
emi.tanaka@monash.edu
-
@statsgen
-
github.com/emitanaka
-
emitanaka.org
28th November 2022 Australasian Applied Statistics Conference 2022
Why data visualisation?
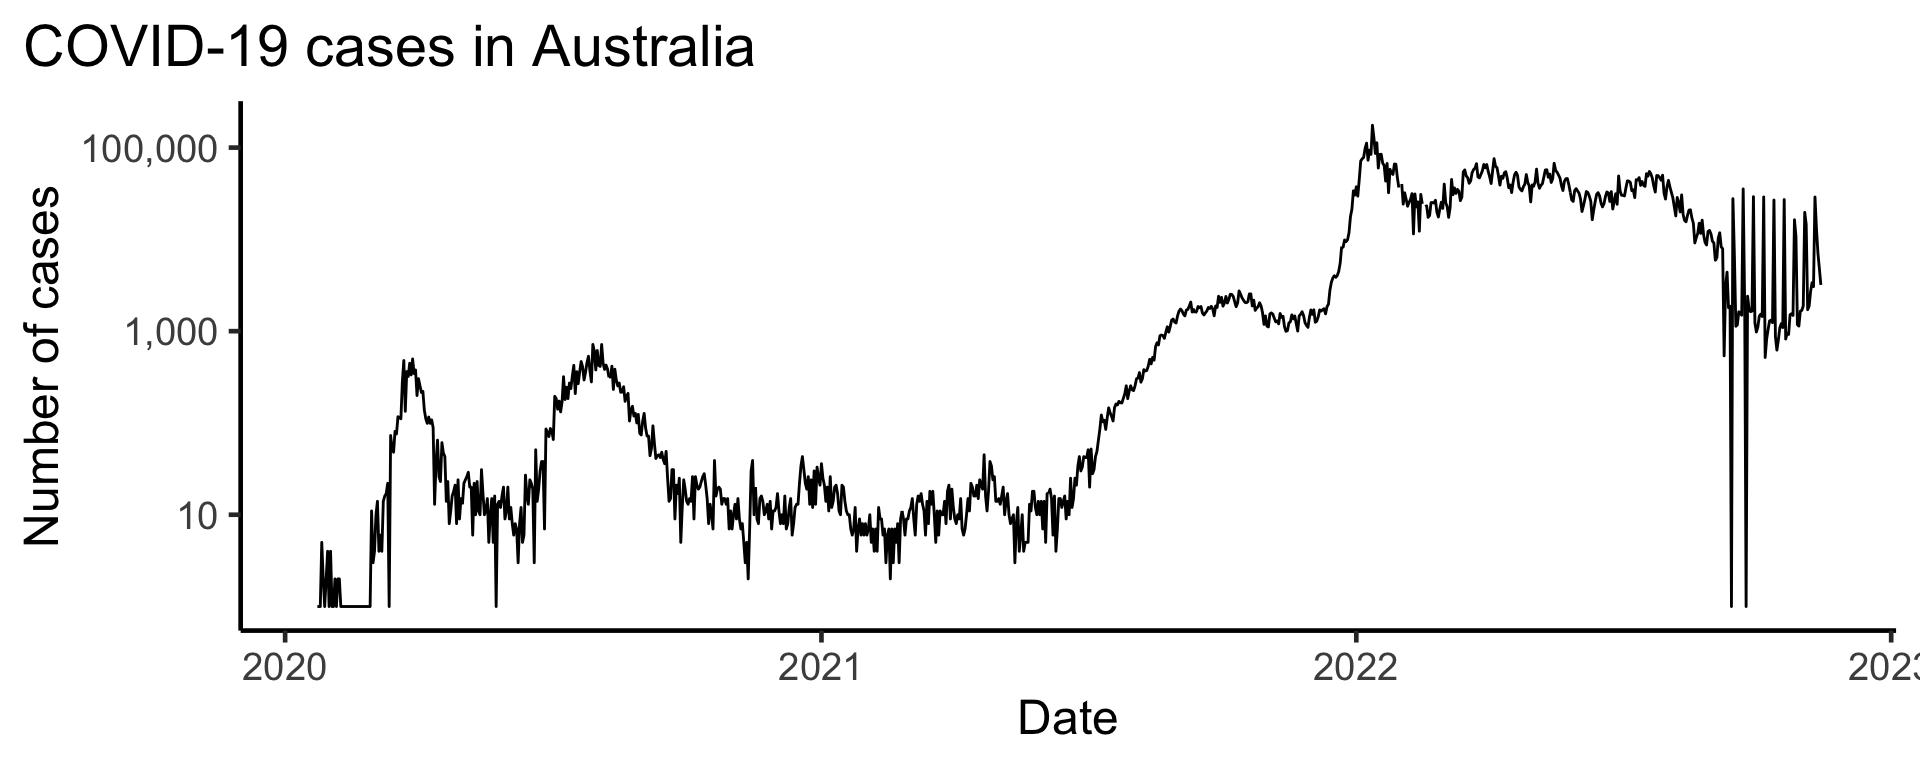
Data visualisation is a powerful tool to explore, understand and communicate data
A data visualisation catalogue
Graphics 🖼️
- Graphics are commonly stored in a standard image format such as svg, jpg (or jpeg), png, pdf, and so on.
- When you view these graphics electronically, you would be using some graphical device to render the stored image.
- In R, the graphic is rendered by the graphical engine,
grDevices (one of the core R package).
Graphics model in R
- Two main graphics model in R are implemented via two core packages:
graphics package, andgrid package.
- Plot using the
graphics system is normally referred to as the base graphics.
- If the graphics is produced using the
grid package, then it is using the grid graphics model.
Base graphics
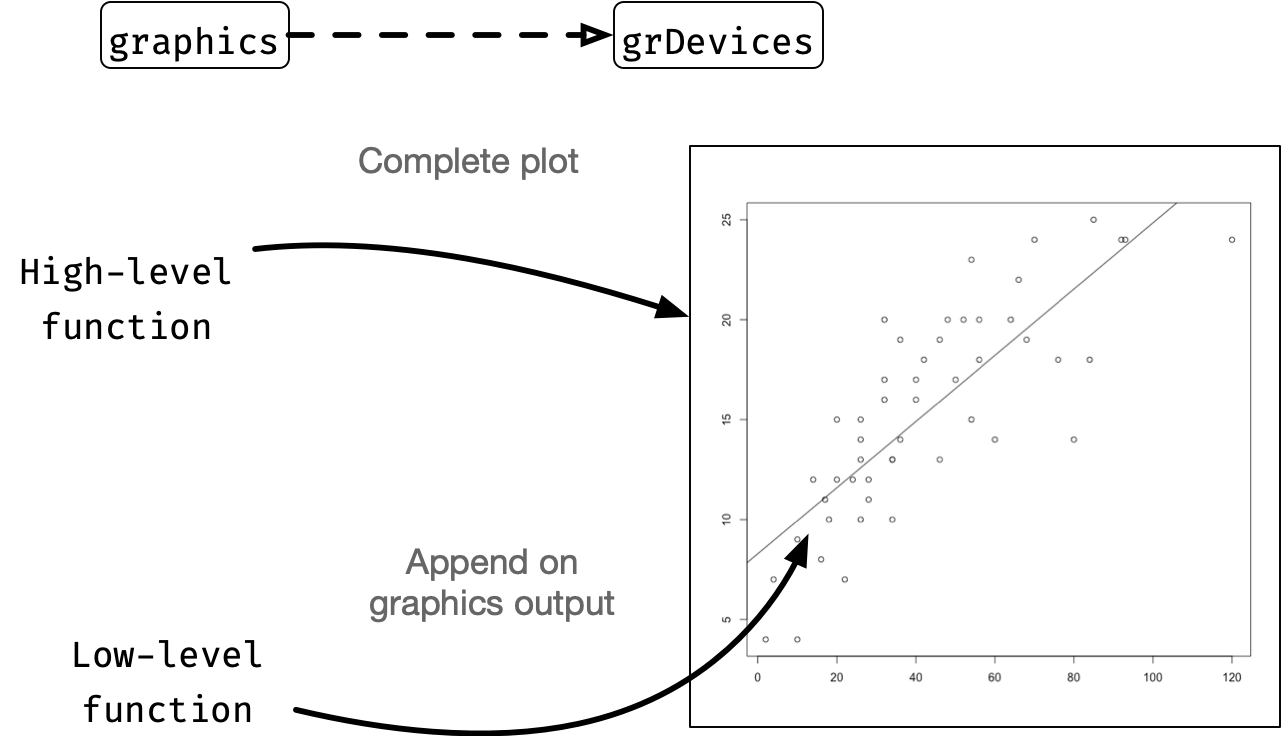
- Base graphics are drawn via the
graphics package.
grid graphics
- The
grid package contains low-level functions, i.e. draws only parts of the plot.
- This system gives a lot of control over the graphics, but requires the user to do a lot of work to draw a complete plot.
- You won’t be directly interacting with the
grid package.
- Instead you’ll be using the
ggplot2 package that provides high-level functions for plotting via the grid system.
Other graphical systems
- All other graphical systems are provided via contributed packages (i.e. you need to install it once to use it).
- The two most well known packages are:
- Both of these packages use the
grid package to draw the plots.
Summary of R graphics
![]()