class: monash-bg-blue center middle hide-slide-number <div class="bg-black white" style="width:45%;right:0;bottom:0;padding-left:5px;border: solid 4px white;margin: auto;"> <i class="fas fa-exclamation-circle"></i> These slides are viewed best by Chrome and occasionally need to be refreshed if elements did not load properly. See here for <a href=part1-session1.pdf>PDF <i class="fas fa-file-pdf"></i></a>. </div> <br> .white[Push the **right arrow key** to see the next slide.] --- count: false background-image: url(images/bg6.jpg) background-size: cover class: hide-slide-number title-slide <div class="grid-row" style="grid: 1fr / 2fr;"> .item.center[ # <span style="text-shadow: 2px 2px 30px white;">Data Visualisation with R<br>Workshop Part 1</span> <!-- ## <span style="color:;text-shadow: 2px 2px 30px black;">Grammar of Graphics</span> --> ] .center.shade_black.animated.bounceInUp.slower[ <br><br> ## Grammar of Graphics <br> Presented by Emi Tanaka Department of Econometrics and Business Statistics <img src="images/monash-one-line-reversed.png" style="width:500px"><br> <span><i class="fas fa-envelope faa-float animated "></i></span> emi.tanaka@monash.edu <span><i class="fab fa-twitter faa-float animated faa-fast "></i></span> @statsgen .bottom_abs.width100.bg-black[ 6th Dec 2021 @ Statistical Society of Australia NSW Branch | Zoom ] ] </div> --- class: transition middle # <i class="fas fa-key"></i> Why grammar of graphics for data visualisation? --- name: base-graphics class: font_smaller # <i class="fas fa-chart-bar"></i> Constructing plots with R: `base` version .grid[ .item.border-right[ ```r df ``` ``` ## # A tibble: 3 × 2 ## duty perc ## <chr> <dbl> ## 1 Teaching 40 ## 2 Research 40 ## 3 Admin 20 ``` [.tag[<i class="fas fa-caret-right"></i> `ggplot2` version]](#ggplot-graphics) ] .item.border-right[ Stacked barplot ```r barplot(as.matrix(df$perc), legend = df$duty) ``` <!-- --> ] .item[ Pie chart ```r pie(df$perc, labels = df$duty) ``` 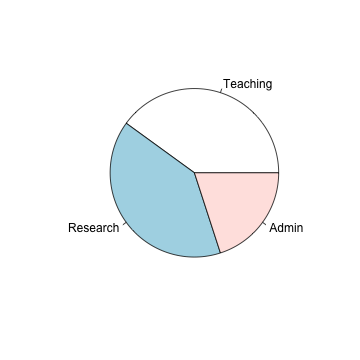<!-- --> ] ] .footnote[ R Core Team (2020) R: A Language and Environment for Statistical Computing https://www.R-project.org/ ] -- .corner-box[ * **Single purpose functions** to generate "named plots" * **Input** varies, here it is vector or matrix ] --- name: graphics-question .grid[ .item.center[ <br> How are **barplots** different to a **pie chart**? 🤔 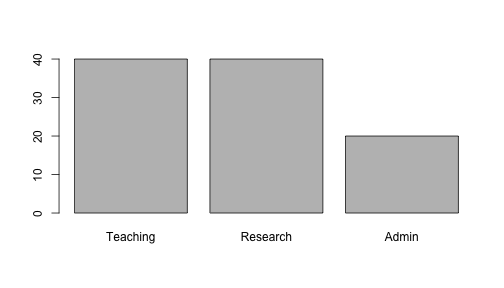<!-- --> Don't they all **depict the same information**? 🤨 ] .item.center[ <!-- --> <!-- --> ] ] <a href="#ggplot-graphics" class="hide-until-hover" style="position:absolute;bottom:10px;left:10px;"><span class="monash-blue2"><i class="fas fa-arrow-circle-right"></i></span></a> --- class: transition middle # .circle-big[1] # Grammar of graphics <img src='images/ggplot2.png' height = '200px'> .footnote.monash-bg-blue[ Wickham (2016) ggplot2: Elegant Graphics for Data Analysis. *Springer-Verlag New York* ] --- # Basic structure of ggplot <center> <br> <img src="images/ggplot-basic-str.png" width="80%"/> </center> .info-box[ 1. **data** as `data.frame` (or `tibble`), 2. a set of **aesthetic** mappings between variables in the data and visual properties, and 3. at least one **layer** which describes how to render each observation. ] --- class: font_smaller # <img src="images/penguins-logo.png" width="50px" style="vertical-align: middle;"> Palmer penguins `penguins` data is from the `palmerpenguins` 📦 .font_small[ ```r library(palmerpenguins) glimpse(penguins) ``` ``` ## Rows: 344 ## Columns: 8 ## $ species <fct> Adelie, Adelie, Adelie, Adelie, Adelie, Adelie, Adel… ## $ island <fct> Torgersen, Torgersen, Torgersen, Torgersen, Torgerse… ## $ bill_length_mm <dbl> 39.1, 39.5, 40.3, NA, 36.7, 39.3, 38.9, 39.2, 34.1, … ## $ bill_depth_mm <dbl> 18.7, 17.4, 18.0, NA, 19.3, 20.6, 17.8, 19.6, 18.1, … ## $ flipper_length_mm <int> 181, 186, 195, NA, 193, 190, 181, 195, 193, 190, 186… ## $ body_mass_g <int> 3750, 3800, 3250, NA, 3450, 3650, 3625, 4675, 3475, … ## $ sex <fct> male, female, female, NA, female, male, female, male… ## $ year <int> 2007, 2007, 2007, 2007, 2007, 2007, 2007, 2007, 2007… ``` ] <img src="images/lter_penguins.png" width = "250px" style = "position:absolute;top:18%;left:25%;"/> <img src="images/culmen_depth.png" width = "450px" style = "position:absolute;bottom:20%;right:5%;border:2px solid black;"/> .footnote[ Horst AM, Hill AP, Gorman KB (2020). palmerpenguins: Palmer Archipelago (Antarctica) penguin data. R package version 0.1.0. https://allisonhorst.github.io/palmerpenguins/ <br> Gorman KB, Williams TD, Fraser WR (2014). Ecological sexual dimorphism and environmental variability within a community of Antarctic penguins (genus Pygoscelis). PLoS ONE 9(3):e90081. ] <div class="tag center animated rubberBand" style="position:absolute;top:2%;left:12%;transform:rotate(-3deg);"> demo data for today </div> --- class: font_small # Aesthestic mappings .center[ aesthestic = column in data ] ```r ggplot(data = penguins, mapping = aes(x = bill_depth_mm, y = bill_length_mm, color = species)) + geom_point() ``` .grid[ .item.center[ <!-- --> ] .item[ <center> <img src="images/aes-mapping.png" width="800px"/> </center> * `bill_depth_mm` is mapped to the `x` coordinate * `bill_length_mm` is mapped to the `y` coordinate * `species` is mapped to the `color` ] ] --- class: font_smaller # Hidden argument names in ggplot <center> <img src="images/hidden-ggplot-argument-names.png" width="95%" style="padding-top:20px;"/> </center> --- .grid[ .item[ ```r ggplot(penguins, aes(species)) ``` <!-- --> ```r ggplot(penguins, aes(species, bill_length_mm)) ``` <!-- --> ] .item[ * No need to write explicitly write out `data = `, `mapping = `, `x = `, and `y = ` each time in `ggplot`. {{content}} ] ] -- * `ggplot` code in the wild often omit these argument names. {{content}} -- * But position needs to be correct if argument names are not specified! {{content}} -- * If no layer is specified, then the plot is `geom_blank()`. --- # Layer .info-box[ Each layer has a * `geom` - the geometric object to use display the data, * `stat` - statisitcal transformations to use on the data, * `data` and `mapping` which is usually inherited from `ggplot` object, .font_small[ Further specifications are provided by `position` adjustment, `show_legend` and so on. ] ] --- # Example layer: geom_point() The `<layer>` is usually created by a function preceded by `geom_` in its name. ```r ggplot(penguins, aes(bill_depth_mm, bill_length_mm)) + * geom_point() ``` <br> is a shorthand for <br> ```r ggplot(penguins, aes(bill_depth_mm, bill_length_mm)) + * layer(geom = "point", * stat = "identity", position = "identity", * params = list(na.rm = FALSE)) ``` --- # Different geometric objects ```r p <- ggplot(penguins, aes(species, bill_length_mm)) ``` .grid[ .item[ ```r p + geom_violin() ``` <!-- --> ] .item[ ```r p + geom_boxplot() ``` <!-- --> ] .item[ ```r p + geom_point() ``` <!-- --> ]] --- name: geom class: hide-slide-number # `geom` <div id="htmlwidget-b1d572b16718e294af6b" style="width:100%;height:auto;" class="datatables html-widget"></div> <script type="application/json" data-for="htmlwidget-b1d572b16718e294af6b">{"x":{"filter":"none","vertical":false,"data":[["geom_abline, geom_hline, geom_vline","geom_bar, geom_col","geom_bin_2d, geom_bin2d","geom_blank","geom_boxplot","geom_contour, geom_contour_filled","geom_count","geom_density","geom_density_2d, geom_density2d, geom_density_2d_filled, geom_density2d_filled","geom_dotplot","geom_errorbarh","geom_function","geom_hex","geom_freqpoly, geom_histogram","geom_jitter","geom_crossbar, geom_errorbar, geom_linerange, geom_pointrange","geom_map","geom_path, geom_line, geom_step","geom_point","geom_polygon","geom_qq_line, geom_qq","geom_quantile","geom_ribbon, geom_area","geom_rug","geom_segment, geom_curve","geom_smooth","geom_spoke","geom_label, geom_text","geom_raster, geom_rect, geom_tile","geom_violin","geom_sf, geom_sf_label, geom_sf_text"],["Reference lines: horizontal, vertical, and diagonal","Bar charts","Heatmap of 2d bin counts","Draw nothing","A box and whiskers plot (in the style of Tukey)","2D contours of a 3D surface","Count overlapping points","Smoothed density estimates","Contours of a 2D density estimate","Dot plot","Horizontal error bars","Draw a function as a continuous curve","Hexagonal heatmap of 2d bin counts","Histograms and frequency polygons","Jittered points","Vertical intervals: lines, crossbars & errorbars","Polygons from a reference map","Connect observations","Points","Polygons","A quantile-quantile plot","Quantile regression","Ribbons and area plots","Rug plots in the margins","Line segments and curves","Smoothed conditional means","Line segments parameterised by location, direction and distance","Text","Rectangles","Violin plot","Visualise sf objects"]],"container":"<table class=\"display\">\n <thead>\n <tr>\n <th>geom<\/th>\n <th>Description<\/th>\n <\/tr>\n <\/thead>\n<\/table>","options":{"dom":"tp","ordering":false,"order":[],"autoWidth":false,"orderClasses":false}},"evals":[],"jsHooks":[]}</script> --- class: font_smaller # Statistical transformation ```r g <- ggplot(penguins, aes(species, bill_length_mm)) + geom_boxplot() ``` <div class="grid" style="grid: 1fr / 300px 900px;"> .item[ <!-- --> ] .item[ * The `y`-axis is not the raw data! * It is plotting a statistical transformation of the `y`-values. * Under the hood, data is transformed (including `x` factor input to numerical values). ```r layer_data(g, 1) ``` ``` ## ymin lower middle upper ymax outliers notchupper notchlower x flipped_aes ## 1 32.1 36.75 38.80 40.750 46.0 39.31431 38.28569 1 FALSE ## 2 40.9 46.35 49.55 51.075 58.0 50.45532 48.64468 2 FALSE ## 3 40.9 45.30 47.30 49.550 55.9 59.6 47.90547 46.69453 3 FALSE ## PANEL group ymin_final ymax_final xmin xmax xid newx new_width weight ## 1 1 1 32.1 46.0 0.625 1.375 1 1 0.75 1 ## 2 1 2 40.9 58.0 1.625 2.375 2 2 0.75 1 ## 3 1 3 40.9 59.6 2.625 3.375 3 3 0.75 1 ## colour fill size alpha shape linetype ## 1 grey20 white 0.5 NA 19 solid ## 2 grey20 white 0.5 NA 19 solid ## 3 grey20 white 0.5 NA 19 solid ``` ] </div> --- class: font_smaller # Statistical transformation: stat_bin * For `geom_histogram`, default is `stat = "bin"`. * For `stat_bin`, default is `geom = "bar"`. * .pink[Every `geom` has a `stat` and vice versa]. ```r p <- ggplot(penguins, aes(bill_length_mm)) ``` <div class="grid" style="grid: 1fr / 1fr 1fr 1fr;"> .item[ ```r p + geom_histogram() ``` <!-- --> ] .item[ ```r p + stat_bin(geom = "bar") ``` <!-- --> ] .item[ ```r p + stat_bin(geom = "line") ``` <!-- --> ] </div> --- class: font_smaller # Using statistical transformations To map an aesthestic to computed statistical variable (say called .pink[`var`]), you can refer to it by either .pink[`stat(var)`] or .pink[`..var..`]. --- .grid[ .item[ `stat = "bin"` ``` ## x count density ## 1 32.24138 1 0.003083466 ## 2 33.18966 2 0.006166932 ## 3 34.13793 6 0.018500797 ## 4 35.08621 7 0.021584264 ## 5 36.03448 18 0.055502392 ## 6 36.98276 13 0.040085061 ## 7 37.93103 22 0.067836257 ## 8 38.87931 18 0.055502392 ## 9 39.82759 19 0.058585859 ## 10 40.77586 21 0.064752791 ## 11 41.72414 13 0.040085061 ## 12 42.67241 15 0.046251994 ## 13 43.62069 13 0.040085061 ## 14 44.56897 9 0.027751196 ## 15 45.51724 27 0.083253589 ## 16 46.46552 30 0.092503987 ## 17 47.41379 14 0.043168527 ## 18 48.36207 15 0.046251994 ## 19 49.31034 18 0.055502392 ## 20 50.25862 25 0.077086656 ## 21 51.20690 16 0.049335460 ## 22 52.15517 9 0.027751196 ## 23 53.10345 4 0.012333865 ## 24 54.05172 2 0.006166932 ## 25 55.00000 1 0.003083466 ## 26 55.94828 2 0.006166932 ## 27 56.89655 0 0.000000000 ## 28 57.84483 1 0.003083466 ## 29 58.79310 0 0.000000000 ## 30 59.74138 1 0.003083466 ``` ] .item[ ```r p + geom_histogram(aes(y = stat(density) )) ``` <!-- --> ```r p + geom_histogram(aes(y = ..density.. )) ``` ] ] --- name: stat class: hide-slide-number # `stat` <div id="htmlwidget-1f6da18d8f52c1c03f04" style="width:100%;height:auto;" class="datatables html-widget"></div> <script type="application/json" data-for="htmlwidget-1f6da18d8f52c1c03f04">{"x":{"filter":"none","vertical":false,"data":[["stat_count","stat_bin_2d, stat_bin2d","stat_boxplot","stat_contour, stat_contour_filled","stat_sum","stat_density","stat_density_2d, stat_density2d, stat_density_2d_filled","stat_function","stat_bin_hex, stat_binhex","stat_bin","stat_qq_line, stat_qq","stat_quantile","stat_smooth","stat_spoke","stat_ydensity","stat_sf","stat_ecdf","stat_ellipse","stat_identity","stat_sf_coordinates","stat_summary_bin, stat_summary","stat_summary_2d, stat_summary2d, stat_summary_hex","stat_unique","update_stat_defaults"],["Bar charts","Heatmap of 2d bin counts","A box and whiskers plot (in the style of Tukey)","2D contours of a 3D surface","Count overlapping points","Smoothed density estimates","Contours of a 2D density estimate","Draw a function as a continuous curve","Hexagonal heatmap of 2d bin counts","Histograms and frequency polygons","A quantile-quantile plot","Quantile regression","Smoothed conditional means","Line segments parameterised by location, direction and distance","Violin plot","Visualise sf objects","Compute empirical cumulative distribution","Compute normal data ellipses","Leave data as is","Extract coordinates from 'sf' objects","Summarise y values at unique/binned x","Bin and summarise in 2d (rectangle & hexagons)","Remove duplicates","Modify geom/stat aesthetic defaults for future plots"]],"container":"<table class=\"display\">\n <thead>\n <tr>\n <th>stat<\/th>\n <th>Description<\/th>\n <\/tr>\n <\/thead>\n<\/table>","options":{"dom":"tp","ordering":false,"order":[],"autoWidth":false,"orderClasses":false}},"evals":[],"jsHooks":[]}</script> --- class: font_smaller # <i class="fas fa-chart-pie"></i> Constructing plots with R: `ggplot2` version .grid[ .item.border-right[ ```r df ``` ``` ## # A tibble: 3 × 2 ## duty perc ## <chr> <dbl> ## 1 Teaching 40 ## 2 Research 40 ## 3 Admin 20 ``` [.tag[<i class="fas fa-caret-right"></i> `base` version]](#base-graphics) ] .item.border-right[ Stacked barplot ```r ggplot(df, aes(x = "", # dummy y = perc, fill = duty)) + geom_col() ``` 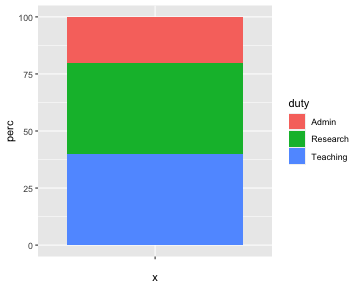<!-- --> ] <div class="item" style="opacity:0;"> Pie chart </div> ] .footnote[ Wilkinson (2005) The Grammar of graphics. *Statistics and Computing. Springer, 2nd edition.* Wickham (2008) Practical Tools for Exploring Data and Models. *PhD Thesis Chapter 3: A layered grammar of graphics*. Wickham (2010) A Layered Grammar of Graphics, *Journal of Computational and Graphical Statistics, 19:1, 3-28* ] --- count: false class: font_smaller name: ggplot-graphics # <i class="fas fa-chart-pie"></i> Constructing plots with R: `ggplot2` version .grid[ .item.border-right[ ```r df ``` ``` ## # A tibble: 3 × 2 ## duty perc ## <chr> <dbl> ## 1 Teaching 40 ## 2 Research 40 ## 3 Admin 20 ``` [.tag[<i class="fas fa-caret-right"></i> `base` version]](#base-graphics) ] .item.border-right[ Stacked barplot ```r ggplot(df, aes(x = "", # dummy y = perc, fill = duty)) + geom_col() ``` <!-- --> ] .item[ Pie chart ```r ggplot(df, aes(x = "", # dummy y = perc, fill = duty)) + geom_col() + * coord_polar(theta = "y") ``` 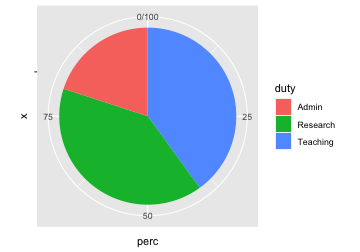<!-- --> <a href="#graphics-question" style="position:absolute;bottom:110px;right:10px;"><div class="monash-blue2"> <i class="fas fa-question-circle"></i> </div></a> ] ] .footnote[ Wilkinson (2005) The Grammar of graphics. *Statistics and Computing. Springer, 2nd edition.* Wickham (2008) Practical Tools for Exploring Data and Models. *PhD Thesis Chapter 3: A layered grammar of graphics*. Wickham (2010) A Layered Grammar of Graphics, *Journal of Computational and Graphical Statistics, 19:1, 3-28* ] -- .corner-box[ The difference between a **stacked barplot** and a **pie chart** is that the coordinate system have been transformed from **Cartesian coordinate** to **polar coordinate**. ] --- class: font_smaller # <i class="fas fa-puzzle-piece"></i> How do we create this barplot in `ggplot`? .grid[ .item[ ```r df ``` ``` ## # A tibble: 3 × 2 ## duty perc ## <chr> <dbl> ## 1 Teaching 40 ## 2 Research 40 ## 3 Admin 20 ``` ```r barplot(df$perc, names.arg = df$duty) ``` <!-- --> ] .item[ ```r ggplot(data = df, aes(x = ..., y = ...)) + geom_... ``` ] ] --- class: font_smaller count: false # <i class="fas fa-puzzle-piece"></i> How do we create this barplot in `ggplot`? .grid[ .item[ ```r df ``` ``` ## # A tibble: 3 × 2 ## duty perc ## <chr> <dbl> ## 1 Teaching 40 ## 2 Research 40 ## 3 Admin 20 ``` ```r barplot(df$perc, names.arg = df$duty) ``` <!-- --> ] .item[ ```r ggplot(data = df, aes(x = duty, y = perc)) + geom_col() ``` 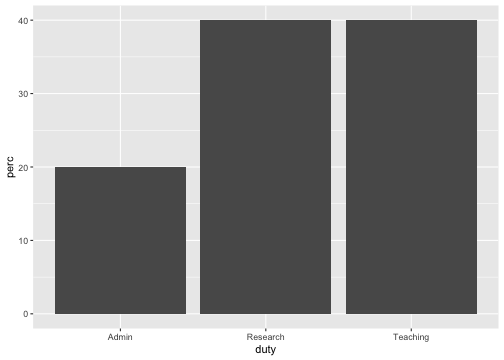<!-- --> ] ] --- class: font_smaller # <i class="fas fa-puzzle-piece"></i> What graph will this yield? .grid[.item.border-right[ ```r df2 ``` ``` ## # A tibble: 6 × 3 ## duty perc type ## <chr> <dbl> <chr> ## 1 Teaching 40 standard ## 2 Research 40 standard ## 3 Admin 20 standard ## 4 Teaching 80 teaching ## 5 Research 0 teaching ## 6 Admin 20 teaching ``` ] .item.border-right[ ```r g <- ggplot(df2, * aes(x = type, y = perc, fill = duty)) + geom_col() g ``` ] .item[ ```r *g + coord_polar("y") ``` ] ] --- count: false class: font_smaller # <i class="fas fa-puzzle-piece"></i> What graph will this yield? .grid[.item.border-right[ ```r df2 ``` ``` ## # A tibble: 6 × 3 ## duty perc type ## <chr> <dbl> <chr> ## 1 Teaching 40 standard ## 2 Research 40 standard ## 3 Admin 20 standard ## 4 Teaching 80 teaching ## 5 Research 0 teaching ## 6 Admin 20 teaching ``` ] .item.border-right[ ```r g <- ggplot(df2, * aes(x = type, y = perc, fill = duty)) + geom_col() g ``` 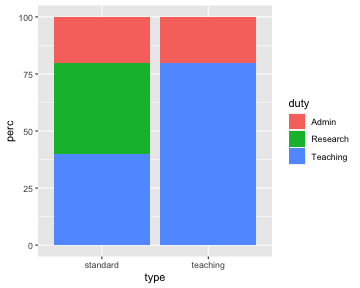<!-- --> ] .item[ ```r *g + coord_polar("y") ``` ] ] --- count: false class: font_smaller # <i class="fas fa-puzzle-piece"></i> What graph will this yield? .grid[.item.border-right[ ```r df2 ``` ``` ## # A tibble: 6 × 3 ## duty perc type ## <chr> <dbl> <chr> ## 1 Teaching 40 standard ## 2 Research 40 standard ## 3 Admin 20 standard ## 4 Teaching 80 teaching ## 5 Research 0 teaching ## 6 Admin 20 teaching ``` ] .item.border-right[ ```r g <- ggplot(df2, * aes(x = type, y = perc, fill = duty)) + geom_col() g ``` <!-- --> ] .item[ ```r *g + coord_polar("y") ``` 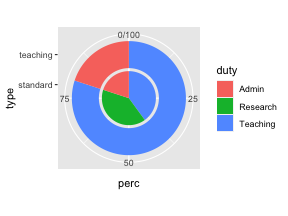<!-- --> {{content}} ] ] -- ```r g + coord_polar("x") ``` {{content}} -- 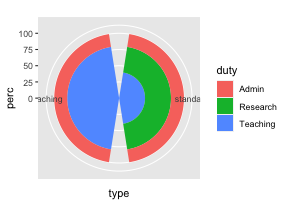<!-- --> --- class: exercise middle hide-slide-number <i class="fas fa-users"></i> # <i class="fas fa-code"></i> Open `part1-exercise-01.Rmd` <center> <div class="countdown clock" id="timer_61ad2b2d" style="right:0;bottom:0;" data-warnwhen="0"> <code class="countdown-time"><span class="countdown-digits minutes">15</span><span class="countdown-digits colon">:</span><span class="countdown-digits seconds">00</span></code> </div> </center> --- class: font_smaller background-color: #e5e5e5 # Session Information .scroll-350[ ```r devtools::session_info() ``` ``` ## ─ Session info 🦵🏾 🛌🏻 👎🏽 ───────────────────────────────────────────────── ## hash: leg: medium-dark skin tone, person in bed: light skin tone, thumbs down: medium skin tone ## ## setting value ## version R version 4.1.2 (2021-11-01) ## os macOS Big Sur 10.16 ## system x86_64, darwin17.0 ## ui X11 ## language (EN) ## collate en_AU.UTF-8 ## ctype en_AU.UTF-8 ## tz Australia/Melbourne ## date 2021-12-06 ## pandoc 2.11.4 @ /Applications/RStudio.app/Contents/MacOS/pandoc/ (via rmarkdown) ## ## ─ Packages ─────────────────────────────────────────────────────────────────── ## package * version date (UTC) lib source ## anicon 0.1.0 2021-11-30 [1] Github (emitanaka/anicon@0b756df) ## assertthat 0.2.1 2019-03-21 [1] CRAN (R 4.1.0) ## backports 1.3.0 2021-10-27 [1] CRAN (R 4.1.0) ## broom 0.7.10 2021-10-31 [1] CRAN (R 4.1.0) ## bslib 0.3.1 2021-10-06 [1] CRAN (R 4.1.0) ## cachem 1.0.6 2021-08-19 [1] CRAN (R 4.1.0) ## callr 3.7.0 2021-04-20 [1] CRAN (R 4.1.0) ## cellranger 1.1.0 2016-07-27 [1] CRAN (R 4.1.0) ## cli 3.1.0 2021-10-27 [1] CRAN (R 4.1.0) ## colorspace 2.0-2 2021-06-24 [1] CRAN (R 4.1.0) ## countdown 0.3.5 2021-11-30 [1] Github (gadenbuie/countdown@a544fa4) ## crayon 1.4.2 2021-10-29 [1] CRAN (R 4.1.0) ## crosstalk 1.2.0 2021-11-04 [1] CRAN (R 4.1.0) ## DBI 1.1.1 2021-01-15 [1] CRAN (R 4.1.0) ## dbplyr 2.1.1 2021-04-06 [1] CRAN (R 4.1.0) ## desc 1.4.0 2021-09-28 [1] CRAN (R 4.1.0) ## devtools 2.4.2 2021-06-07 [1] CRAN (R 4.1.0) ## digest 0.6.28 2021-09-23 [1] CRAN (R 4.1.0) ## dplyr * 1.0.7 2021-06-18 [1] CRAN (R 4.1.0) ## DT 0.20 2021-11-15 [1] CRAN (R 4.1.0) ## ellipsis 0.3.2 2021-04-29 [1] CRAN (R 4.1.0) ## evaluate 0.14 2019-05-28 [1] CRAN (R 4.1.0) ## fansi 0.5.0 2021-05-25 [1] CRAN (R 4.1.0) ## farver 2.1.0 2021-02-28 [1] CRAN (R 4.1.0) ## fastmap 1.1.0 2021-01-25 [1] CRAN (R 4.1.0) ## forcats * 0.5.1 2021-01-27 [1] CRAN (R 4.1.0) ## fs 1.5.0 2020-07-31 [1] CRAN (R 4.1.0) ## generics 0.1.1 2021-10-25 [1] CRAN (R 4.1.0) ## ggplot2 * 3.3.5 2021-06-25 [1] CRAN (R 4.1.0) ## glue 1.5.0 2021-11-07 [1] CRAN (R 4.1.0) ## gtable 0.3.0 2019-03-25 [1] CRAN (R 4.1.0) ## haven 2.4.3 2021-08-04 [1] CRAN (R 4.1.0) ## highr 0.9 2021-04-16 [1] CRAN (R 4.1.0) ## hms 1.1.1 2021-09-26 [1] CRAN (R 4.1.0) ## htmltools 0.5.2 2021-08-25 [1] CRAN (R 4.1.0) ## htmlwidgets 1.5.4 2021-09-08 [1] CRAN (R 4.1.0) ## httr 1.4.2 2020-07-20 [1] CRAN (R 4.1.0) ## icon 0.1.0 2021-11-30 [1] Github (emitanaka/icon@8458546) ## jquerylib 0.1.4 2021-04-26 [1] CRAN (R 4.1.0) ## jsonlite 1.7.2 2020-12-09 [1] CRAN (R 4.1.0) ## knitr 1.36 2021-09-29 [1] CRAN (R 4.1.0) ## labeling 0.4.2 2020-10-20 [1] CRAN (R 4.1.0) ## lifecycle 1.0.1 2021-09-24 [1] CRAN (R 4.1.0) ## lubridate 1.8.0 2021-10-07 [1] CRAN (R 4.1.0) ## magrittr 2.0.1 2020-11-17 [1] CRAN (R 4.1.0) ## memoise 2.0.0 2021-01-26 [1] CRAN (R 4.1.0) ## modelr 0.1.8 2020-05-19 [1] CRAN (R 4.1.0) ## munsell 0.5.0 2018-06-12 [1] CRAN (R 4.1.0) ## palmerpenguins * 0.1.0 2020-07-23 [1] CRAN (R 4.1.0) ## pillar 1.6.4 2021-10-18 [1] CRAN (R 4.1.0) ## pkgbuild 1.2.0 2020-12-15 [1] CRAN (R 4.1.0) ## pkgconfig 2.0.3 2019-09-22 [1] CRAN (R 4.1.0) ## pkgload 1.2.3 2021-10-13 [1] CRAN (R 4.1.0) ## prettyunits 1.1.1 2020-01-24 [1] CRAN (R 4.1.0) ## processx 3.5.2 2021-04-30 [1] CRAN (R 4.1.0) ## ps 1.6.0 2021-02-28 [1] CRAN (R 4.1.0) ## purrr * 0.3.4 2020-04-17 [1] CRAN (R 4.1.0) ## R6 2.5.1 2021-08-19 [1] CRAN (R 4.1.0) ## Rcpp 1.0.7 2021-07-07 [1] CRAN (R 4.1.0) ## readr * 2.1.0 2021-11-11 [1] CRAN (R 4.1.0) ## readxl 1.3.1 2019-03-13 [1] CRAN (R 4.1.0) ## remotes 2.4.1 2021-09-29 [1] CRAN (R 4.1.0) ## reprex 2.0.1 2021-08-05 [1] CRAN (R 4.1.0) ## rlang 0.4.12 2021-10-18 [1] CRAN (R 4.1.0) ## rmarkdown 2.11 2021-09-14 [1] CRAN (R 4.1.0) ## rprojroot 2.0.2 2020-11-15 [1] CRAN (R 4.1.0) ## rstudioapi 0.13 2020-11-12 [1] CRAN (R 4.1.0) ## rvest 1.0.2 2021-10-16 [1] CRAN (R 4.1.0) ## sass 0.4.0 2021-05-12 [1] CRAN (R 4.1.0) ## scales 1.1.1 2020-05-11 [1] CRAN (R 4.1.0) ## sessioninfo 1.2.1 2021-11-02 [1] CRAN (R 4.1.0) ## stringi 1.7.5 2021-10-04 [1] CRAN (R 4.1.0) ## stringr * 1.4.0 2019-02-10 [1] CRAN (R 4.1.0) ## testthat 3.1.0 2021-10-04 [1] CRAN (R 4.1.0) ## tibble * 3.1.6 2021-11-07 [1] CRAN (R 4.1.0) ## tidyr * 1.1.4 2021-09-27 [1] CRAN (R 4.1.0) ## tidyselect 1.1.1 2021-04-30 [1] CRAN (R 4.1.0) ## tidyverse * 1.3.1 2021-04-15 [1] CRAN (R 4.1.0) ## tzdb 0.2.0 2021-10-27 [1] CRAN (R 4.1.0) ## usethis 2.1.3 2021-10-27 [1] CRAN (R 4.1.0) ## utf8 1.2.2 2021-07-24 [1] CRAN (R 4.1.0) ## vctrs 0.3.8 2021-04-29 [1] CRAN (R 4.1.0) ## whisker 0.4 2019-08-28 [1] CRAN (R 4.1.0) ## withr 2.4.2 2021-04-18 [1] CRAN (R 4.1.0) ## xaringan 0.22 2021-06-23 [1] CRAN (R 4.1.0) ## xfun 0.28 2021-11-04 [1] CRAN (R 4.1.0) ## xml2 1.3.2 2020-04-23 [1] CRAN (R 4.1.0) ## yaml 2.2.1 2020-02-01 [1] CRAN (R 4.1.0) ## ## [1] /Library/Frameworks/R.framework/Versions/4.1/Resources/library ## ## ────────────────────────────────────────────────────────────────────────────── ``` ] These slides are licensed under <br><center><a href="https://creativecommons.org/licenses/by-sa/3.0/au/"><img src="images/cc.svg" style="height:2em;"/><img src="images/by.svg" style="height:2em;"/><img src="images/sa.svg" style="height:2em;"/></a></center>