Inference for linear regression

STAT1003 – Statistical Techniques

Dr. Emi Tanaka

Australian National University

These slides are best viewed on a modern browser like Google Chrome on a desktop or laptop. Some interactive components may require some time to fully load.

Making inferences

  • The standard deviation of an estimator is referred to as the standard error.
  • In making inferences, you may like to know:
    • what is the standard error of \(\hat{\beta}_1\)?
    • is \(\beta_1 \neq 0\)?
    • what is the confidence interval of the average \(y\) for a given \(x\)?
    • what is the prediction interval of \(y\) for a given \(x\)?
  • It’s important to note that making inferences require the assumptions of the linear regression model to be satisfied.
  • So check model assumptions first!

Hypothesis testing for regression parameters

  • Hypothesis: Suppose we want to test if the \(j\)-th regression parameter is significant: \[H_0: \beta_j = 0 \quad \text{vs} \quad H_A: \beta_j \neq 0\] where \(j \in \{1, ..., p\}\) and \(p\) is the number of regression parameters. Note for simple linear regression \(p = 2\).

  • Assumption: suppose the errors are independent and identically normally distributed with mean \(0\) and constant variance \(\sigma^2\).

  • Test statistic: The test statistic and its distribution under \(H_0\) is \[t = \dfrac{\hat{\beta}_j - \beta_j}{\text{SE}(\hat{\beta}_j)} \sim t_{n-p}.\] where \(\text{SE}(\hat{\beta}_j)\) is the standard error of \(\hat{\beta}_j\).

Hypothesis testing for regression parameters: P-value

  • P-value: \(P(|t_{n - p}| > |t|)\)

Model objects to tidy data

So how do I extract these summary values out?

Confidence interval for regression parameters

  • The \(100(1-\alpha)\%\) confidence interval for the \(j\)-th regression parameter is

\[\hat{\beta}_j \pm t_{n-p, \alpha/2} \times \text{SE}(\hat{\beta}_j).\]

  • For \(\alpha = 0.05\), the 95% confidence interval for the regression parameters are:

Confidence interval for the response

  • The 95% confidence interval for the mean response at \(x = 5\) is \[\hat{y} \pm t_{n-p, \alpha/2} \times \text{SE}(\hat{y})\] where \(\hat{y} = \hat{\beta}_0 + \hat{\beta}_1 \times 5\).

Prediction interval for the response

  • The prediction interval considers the uncertainty in the error as well and is always wider than the corresponding confidence interval.
  • The 95% prediction interval for the response at \(x = 5\) is \[\hat{y} \pm t_{n-p, \alpha/2} \times \sqrt{\text{SE}(\hat{y})^2 + \hat{\sigma}^2}\] where \(\hat{y} = \hat{\beta}_0 + \hat{\beta}_1 \times 5\).

Standard error for the response

\[\text{SE}(\hat{y}) = \sqrt{\text{Var}(\hat{\beta}_0 + \hat{\beta}_1 x)} = \sqrt{\text{Var}(\hat{\beta}_0) + x^2 \text{Var}(\hat{\beta}_1) + 2x \text{Cov}(\hat{\beta}_0, \hat{\beta}_1)}.\]

Summary

scroll

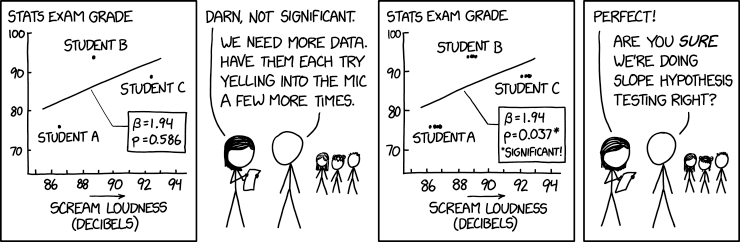
Source: xkcd

  • Fitting a linear model:
  • Getting the model summary:
  • Getting just the regression coefficient estimates
  • Getting the regression coefficient table in the model summary as a tibble:
  • Getting the fitted values \(\hat{y}_i = \hat{\beta}_0 + \hat{\beta}_1 x_i\):
  • Getting the residuals \((y_i - \hat{y}_i)\):
  • Augment the data with fitted values, residuals, etc:
  • Getting the deviance (residual sum of squares):
  • The estimate of the error standard deviation \(\hat{\sigma}\):
  • Getting the influence measures such as Cook’s distance and leverage values:
  • Selecting \(\lambda\) for box-cox transformation:
  • Quick diagnostic plots:
  • Confidence interval for regression parameters:
  • Prediction for mean response:
  • Confidence interval for mean response:
  • Prediction interval for response:
  • Standard error for prediction of mean response: