Hypothesis testing for population mean
STAT1003 – Statistical Techniques
Dr. Emi Tanaka
Australian National University
These slides are best viewed on a modern browser like Google Chrome on a desktop or laptop. Some interactive components may require some time to fully load.
Example: adult height
I am 160 cm tall.
Am I significantly shorter than the average adult woman in Australia?
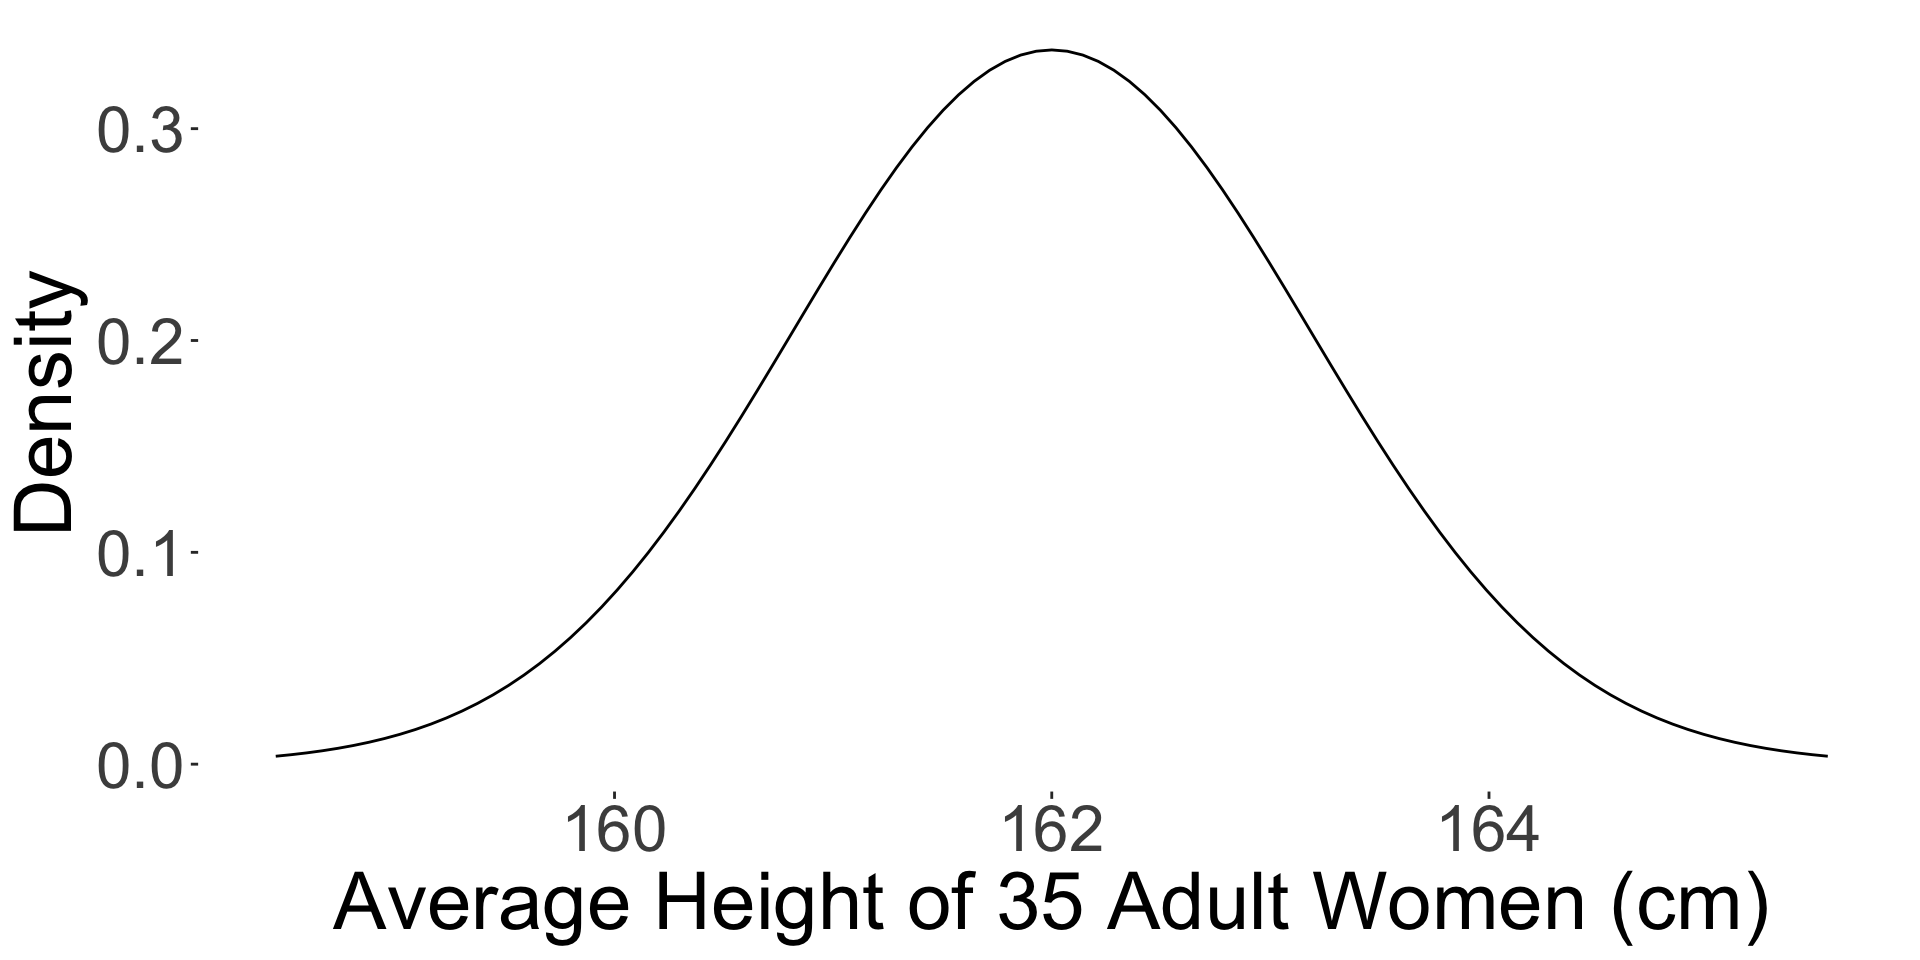
- I collect a random sample of 35 adult women in Australia and measure their heights.
- The sample mean height is 162 cm and the sample standard deviation is 7 cm.
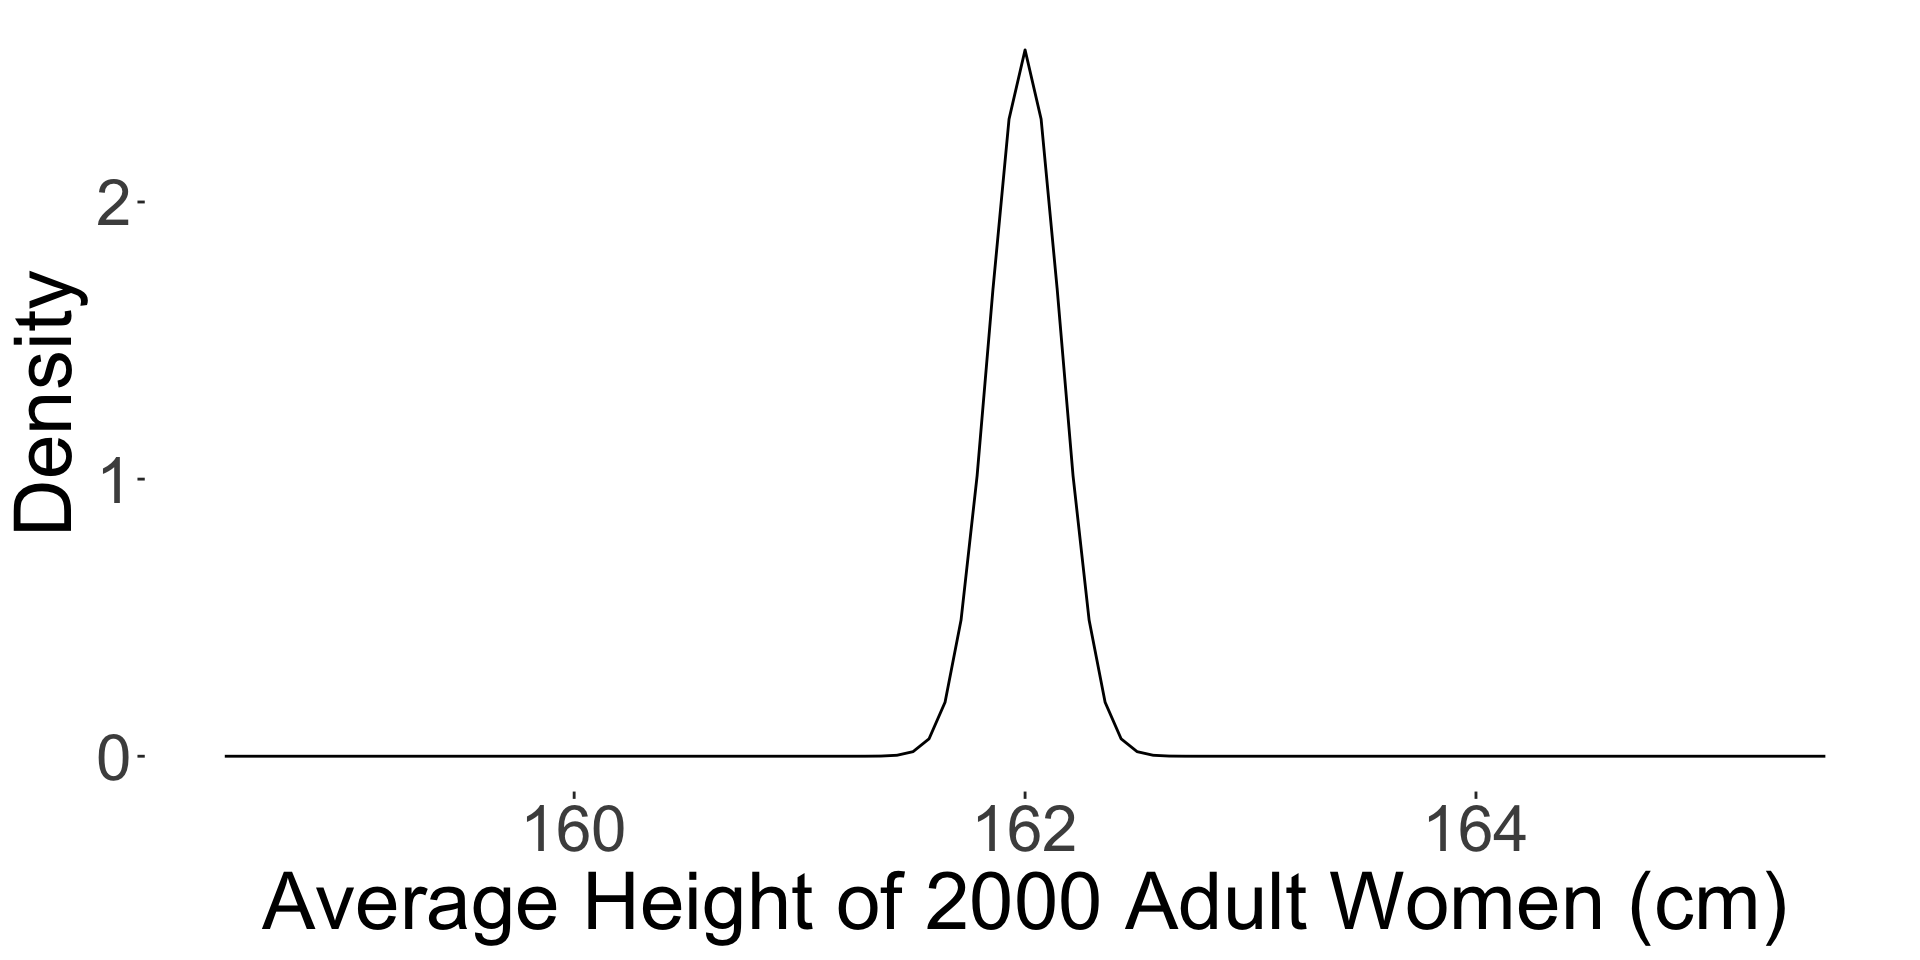
- I collect a random sample of 2000 adult women in Australia and measure their heights.
- The sample mean height is 162 cm and the sample standard deviation is 7 cm.
Testing for the population mean
\(H_0: \mu = \mu_0\) vs. \(H_A: \mu \neq \mu_0\) or \(H_A: \mu > \mu_0\) or \(H_A: \mu < \mu_0\)
We observe \(n\) samples from a population with mean \(\mu\) and standard deviation \(\sigma\).
- The test statistic for population mean is often the sample mean \(\bar{X}\) or its standardized form:
- \(Z = \dfrac{\bar{X} - \mu_0}{\sigma / \sqrt{n}}\) if \(\sigma\) is known, or
- \(T = \dfrac{\bar{X} - \mu_0}{S / \sqrt{n}}\) if \(\sigma\) is unknown, where \(S\) is the sample standard deviation.
- For large \(n\) or if the population is normally distributed:
- \(Z \sim N(0, 1)\) under \(H_0\), and
- \(T \sim t_{n-1}\) under \(H_0\).
Decisions in hypothesis testing
- We have so far used the p-value to make a conclusion in hypothesis testing.
- For \(H_0: \mu = \mu_0\) vs.
- \(H_A: \mu > \mu_0\), p-value = \(P(Z \geq z^*)\) or \(P(T \geq t^*)\),
- \(H_A: \mu < \mu_0\), p-value = \(P(Z \leq z^*)\) or \(P(T \leq t^*)\),
- \(H_A: \mu \neq \mu_0\), p-value = \(P(|Z| \geq |z^*|)\) or \(P(|T| \geq |t^*|)\).
- We reject \(H_0\) if p-value < \(\alpha\) and fail to reject \(H_0\) if p-value \(\geq \alpha\).
- Or for a two-sided test, we can:
- reject \(H_0\) if the confidence interval does not contain \(\mu_0\) and
- data is consistent with \(H_0\) or fail to reject \(H_0\) if the confidence interval contains \(\mu_0\).
- Or we check if the test statistic falls in the rejection region (reject \(H_0\)) or not (fail to reject \(H_0\)).
- Note: we say “fail to reject \(H_0\)” instead of “accept \(H_0\)” because we can never be sure that \(H_0\) is true. We can alternatively say that the data is consistent with \(H_0\).
Rejection region for hypothesis testing
The rejection region is the set of values of the test statistic that leads to rejection of \(H_0\).
- For \(H_0: \mu = \mu_0\):
| Alternative Hypothesis | Rejection Region for \(\sigma\) known | Rejection Region for \(\sigma\) unknown |
|---|---|---|
| \(H_A: \mu > \mu_0\) | \((z^*_{\alpha}, \infty)\) | \((t^*_{n - 1, \alpha}, \infty)\) |
| \(H_A: \mu < \mu_0\) | \((-\infty, z^*_{\alpha})\) | \((-\infty, t^*_{n - 1, \alpha})\) |
| \(H_A: \mu \neq \mu_0\) | \((-\infty, -|z^*_{\alpha/2}|) \cup (|z^*_{\alpha/2}|, \infty)\) | \((-\infty, -|t^*_{n - 1, \alpha/2}|) \cup (|t^*_{n - 1, \alpha/2}|, \infty)\) |
where the critical values are defined as:
- \(z^*_{\alpha}\) is such that \(P(Z \geq z^*_{\alpha}) = \alpha\) for \(Z \sim N(0, 1)\), and
- \(t^*_{n - 1, \alpha}\) is such that \(P(T \geq t^*_{n - 1, \alpha}) = \alpha\) for \(T \sim t_{n - 1}\).
Example: calculating the p-value
I am 160 cm tall. Am I significantly shorter than the average adult woman in Australia?
\(H_0: \mu = 160\) (I’m average height) vs. \(H_A: \mu > 160\) (I am shorter than the population average)
One-sample t-test with R
Statistical vs. Practical significance
\(H_0: \mu_1 = \mu_2\) vs. \(H_A: \mu_1 \neq \mu_2\)
- The above code generates two samples of one million observations each from normal distributions with means 0 and 0.0001, respectively, and standard deviation 0.01.
- The true difference in means is 0.0001, but the p-value will be much less than 0.05 in most cases.
- While the difference is statistically significant, it may not be practically significant.
- So look at the actual difference or “effect size” in addition to the context of the data.
Type II Error and Power
- Recall Type II Error is failing to reject \(H_0\) when \(H_A\) is actually true.
- Let \(\beta = P(\text{Type II error})\) be the probability of making a Type II error.
The power of a test is defined as \(1 - \beta\), which is the probability of correctly rejecting \(H_0\) when \(H_A\) is true.
- The true parameter value under \(H_A\) is often unknown, so we cannot calculate \(\beta\) or power directly from the data.
- However, we can calculate \(\beta\) or power for a specific parameter value under \(H_A\) using the distribution of the test statistic under that parameter value.
- Power calculations are often used in the design phase of a study to determine the required sample size to achieve a desired level of power for detecting a meaningful effect size.
Calculating Type II Error
The population adult woman mean height is 165 cm and population standard deviation is 15 cm. What is the probability that we will make a Type II Error if we collect a new sample of size 35 and conduct hypothesis testing with significance level 0.05?
- \(H_0: \mu = 160\) vs. \(H_A: \mu > 160\)
- The critical value for \(\alpha = 0.05\) is \(z^*_{0.05} = 1.645\), so we fail to reject \(H_0\) if \[Z = \dfrac{\bar{X} - 160}{15 / \sqrt{35}}< 1.645 \rightarrow \bar{X} < 160 + 1.645 \times \frac{15}{\sqrt{35}} = 164.1708.\]
- \(P(\text{Type II error}) = P(\bar{X} < 164.1708 \mid \mu = 165)\), i.e. \(\bar{X} \sim N(165, 15^2 / 35)\) under \(H_A: \mu = 165\).
Summary
Hypothesis testing for a single population mean:
- Hypotheses: State the null and alternative hypotheses.
- Assumptions: Check the assumptions or conditions for the test.
- Test Statistic: Calculate the observed test statistic \(\bar{x}\) or its standardized form \(z^* = \frac{\bar{x} - \mu_0}{\sigma / \sqrt{n}}\) (\(\sigma\) is known) or \(t^* = \frac{\bar{x} - \mu_0}{s / \sqrt{n}}\) (\(\sigma\) is unknown) and \(Z\sim N(0, 1)\) or \(T \sim t_{n-1}\) under \(H_0\).
- P-value or confidence Interval or rejection region: \(H_0: \mu = \mu_0\):
| \(H_A\) | P-value | Confidence Interval | Rejection Region |
|---|---|---|---|
| \(\mu > \mu_0\) | \(P(Z \geq z^*)\) or \(P(T \geq t^*)\) | - | \((z^*_{\alpha}, \infty)\) or \((t^*_{n - 1, \alpha}, \infty)\) |
| \(\mu < \mu_0\) | \(P(Z \leq z^*)\) or \(P(T \leq t^*)\) | - | \((-\infty, z^*_{\alpha})\) or \((-\infty, t^*_{n - 1, \alpha})\) |
| \(\mu \neq \mu_0\) | \(P(|Z| \geq |z^*|)\) or \(P(|T| \geq |t^*|)\) | \(\bar{x} \pm z^*_{\alpha/2} \frac{\sigma}{\sqrt{n}}\) or \(\bar{x} \pm t^*_{n-1, \alpha/2} \frac{s}{\sqrt{n}}\) | \((-\infty, -|z^*_{\alpha/2}|) \cup (|z^*_{\alpha/2}|, \infty)\) or \((-\infty, -|t^*_{n - 1, \alpha/2}|) \cup (|t^*_{n - 1, \alpha/2}|, \infty)\) |
- Conclusion: For a given significance level \(\alpha\), draw conclusion based on whether:
- p-value \(< \alpha\) or not, or
- confidence interval contains \(\mu_0\) or not for a two-sided test only, or
- observed test statistic falls in the rejection region or not.
Always interpret the results of hypothesis testing in the context of the data and the research question.
![]()
STAT1003 – Statistical Techniques