Dynamic documents with data analysis code

STAT1003 – Statistical Techniques

Dr. Emi Tanaka

Australian National University

These slides are best viewed on a modern browser like Google Chrome on a desktop or laptop. Some interactive components may require some time to fully load.
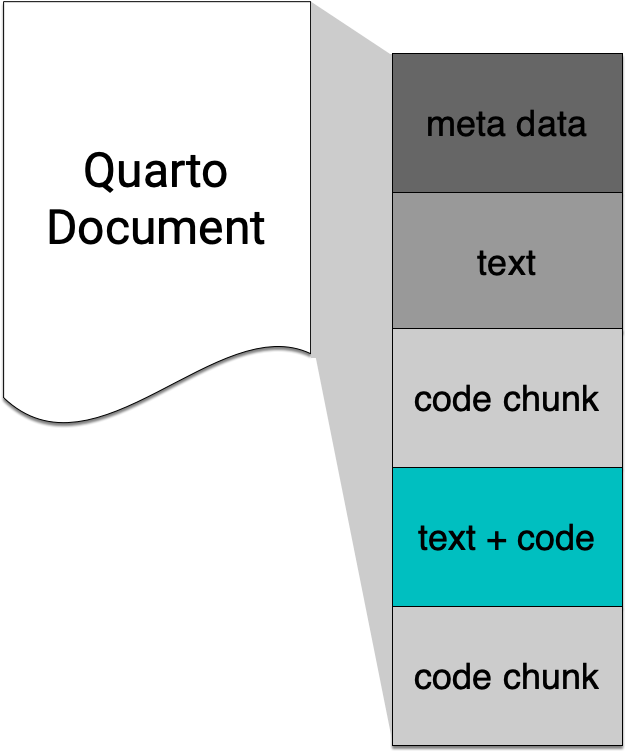
Code chunks

  • In Quarto (and R Markdown), code is included in code chunks.
  • Code chunks are delimited by triple backticks ``` with the language specified after the opening backticks.

Computation:

```{r}
table(penguins$species)
```

   Adelie Chinstrap    Gentoo 
      152        68       124 

Plotting:

```{r}
library(tidyverse)
ggplot(penguins, aes(body_mass)) + 
      geom_histogram(bins = 30)
```

Chunk options

```{r}
#| label: fig-plot
#| eval: true
#| echo: false
#| fig-width: 5
#| fig-height: 3.5
#| fig-cap: "A scatter plot of bill length and body mass."
library(ggplot2)
ggplot(penguins, aes(bill_len, body_mass)) +
  geom_point()
```
Figure 1: A scatter plot of bill length and body mass.
  • label: label for the chunk (for cross-referencing)
  • eval: whether to evaluate the code (true or false)
  • echo: whether to show the code in the output (true or false)
  • fig-width: width of the figure (in inches)
  • fig-height: height of the figure (in inches)
  • fig-cap: caption for the figure

See more options for the knitr engine at here.

Quarto (and R Markdown) is not just for R

  • To use Python, change the language to python:
```{python}
2 * 2 + 3
```
7
  • To use Julia, change the language to julia:
```{julia}
3 + 3
```
6

Note: doesn’t work as well with Julia.

The following languages are supported by knitr:

asis, asy, awk, bash, block, block2, bslib, c, cat, cc, coffee, comment, css, ditaa, dot, embed, eviews, exec, fortran, fortran95, gawk, glue, glue_sql, gluesql, go, groovy, haskell, highlight, js, julia, lein, mermaid, mysql, node, octave, ojs, perl, php, psql, python, r, rcpp, rscript, ruby, sas, sass, scala, scss, sed, sh, sql, stan, stata, targets, tikz, verbatim, zsh

Inline R code


`r some_r_code()`


The number of observations in the `ChickWeight` dataset 
is **`r nrow(ChickWeight)`**.

The value of $\pi$ is `r pi`.


The number of observations in the ChickWeight dataset is 578.

The value of \(\pi\) is 3.1415927.


  • Note that these inline R command only work if engine: knitr.
  • This doesn’t work for other languages.